Aviation Investigation Report A16Q0020
Temporary difficulty with aircraft control
Jazz Aviation LP (dba Air Canada Express)
DHC-8-102, C-GJMO
Mont-Joli Airport, Quebec
The Transportation Safety Board of Canada (TSB) investigated this occurrence for the purpose of advancing transportation safety. It is not the function of the Board to assign fault or determine civil or criminal liability. This report is not created for use in the context of legal, disciplinary or other proceedings. See Ownership and use of content.
-
Table of contents
Summary
The Jazz Aviation LP (doing business as Air Canada Express) DHC-8-102 (registration C-GJMO, serial number 079) was operating as flight 8964 (JZA8964) from Montréal/Pierre Elliott Trudeau International Airport, Quebec, to Mont-Joli Airport, Quebec, with 24 passengers and 3 crew members on board. At 1852 Eastern Standard Time, the Montréal Area Control Centre cleared JZA8964 for the area navigation approach for Runway 06 at Mont-Joli. As the aircraft was descending through 2480 feet above sea level with the landing gear down, the aircraft encountered moderate turbulence. The maximum landing gear extended speed was exceeded, and the pilot flying disconnected the autopilot. The pilot flying experienced temporary difficulty controlling the aircraft but was able to maintain the approach profile and carry out the landing with no further difficulty. After landing, the aircraft taxied normally to the air terminal, and the passengers disembarked. There were no injuries and no damage to the aircraft. The occurrence took place during the hours of darkness.
This report is also available in English.
1.0 Factual information
1.1 History of the flight
On the day of the occurrence, the crew operated flight 8697 (JZA8697) from Sept-Îles Airport (CYZV), Quebec, to Montréal/Pierre Elliott Trudeau International Airport (CYUL), Quebec, which landed at 1631.Footnote 1 Throughout that flight, the crew discussed the weather conditions, and how flight 8964 (JZA8964), which they would next be operating to Mont-Joli Airport (CYYY), Quebec, might be affected.
While on the ground at CYUL, the crew reviewed the weather forecast for the occurrence flight, which was scheduled to depart at 1745. The weather forecast called for severe clear icing conditions and turbulence near CYYY as a warm front was approaching from the west. Because the weather system appeared to be moving faster than originally forecasted, the crew expressed their concern to the company flight dispatcher about possible icing conditions at CYYY, as well as the possibility that the return flight to CYUL would not be able to leave because of the area of freezing rain that might be affecting the airport by the time the aircraft was scheduled to take off from CYYY. However, the weather still met legal, as well as company, requirements for dispatch, so the crew and the flight dispatcher agreed that the flight could proceed as scheduled.
At 1757, JZA8964 left CYUL with 24 passengers and 3 crew members on board. The pilot‑in‑command (PIC) was the pilot flying (PF), and the first officer was the pilot monitoring (PM). After take-off, the aircraft levelled off briefly at 5300 feet above sea level (ASL)Footnote 2 before continuing its climb and reaching its cruising altitude of flight level 250Footnote 3 by 1832. At 1838, when it was 119 nautical miles (nm) west of CYYY, the aircraft commenced the descent for a planned straight-in area navigation approach for Runway 06. To minimize the exposure to icing and turbulence, the crew planned to fly a steeper descent.
At 1843, the Montréal Area Control Centre controller enquired if the crew was aware of significant meteorological information (SIGMET)Footnote 4 J8, advising of an area of freezing rain and severe icing below 6000 feet above ground level (AGL) in an area 30 nm west of CYYY. The PM replied that they had seen the area on the graphical area forecast (GFA).
At 1848, approximately 55 nm from CYYY, JZA8964 levelled off at 14 000 feet for a period of approximately 3 minutes to remain clear of cloud and turbulence. The crew reduced the airspeed from approximately 200 KCASFootnote 5 to 170 KCAS, to avoid being required to carry out a holding procedure because an aircraft was approaching CYYY from the east. The descent resumed at 1851, 50 nm from CYYY, with an average rate of descent of 1100 feet per minute (fpm).
At 1850, the PM contacted Mont-Joli Radio to request a pilot weather report from an aircraft on approach ahead of them. That aircraft was inbound from CYZV and on approach for Runway 24. When asked, the crew of the approaching aircraft confirmed that they had encountered turbulence starting at 4000 feet and that they had acquired visual contact with the airport at 2200 feet. When questioned about entering the cloud layer and possible icing, the crew replied "11 000 feet," but did not provide any further details.
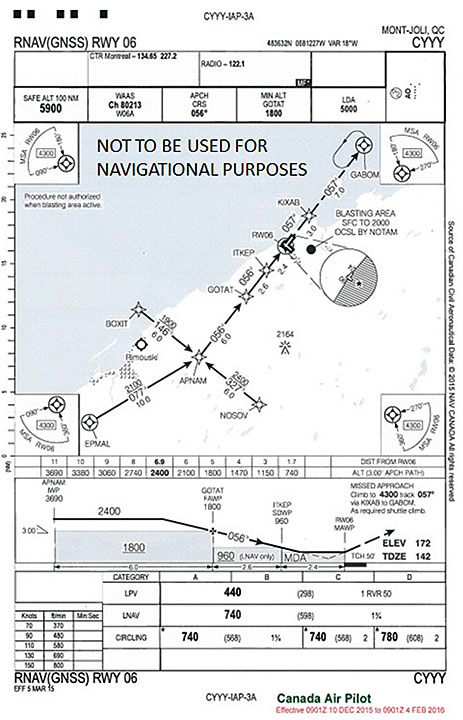
At 1852, Montréal Area Control Centre cleared JZA8964 for an approach to CYYY and transferred the flight to Mont-Joli Radio. On initial contact, the crew confirmed that they were 12 nm from the initial approach waypoint EPMAL, and were planning an area navigation approach for Runway 06 (Appendix A).
At 1856, Mont-Joli Radio asked JZA8964 if they were aware of SIGMET J8, to which the crew replied that they were. Two minutes later, Mont-Joli Radio broadcasted SIGMET J8, in both French and English, over the mandatory frequency.
At 1900, the PF asked whether it was normal procedure to broadcast a SIGMET live. Mont‑Joli Radio replied that it is standard procedure to broadcast all SIGMETs affecting a 20 nm radius around the airport. The PF advised that the broadcast was a distraction while dealing with the higher workload associated with preparing for an instrument approach. A few seconds after this discussion, the aircraft passed the intermediate waypoint APNAM, as it descended through 4300 feet, with an approximate speed of 170 KCAS.
The power was reduced to idle, the gear was lowered, and the speed was stabilized at approximately 150 KCAS in this configuration with the autopilot in vertical speed (VS)Footnote 6 mode. At 1901, the airspeed gradually increased to 171 KCAS as the aircraft descended from 3340 to 2480 feet.
At 1901:39, the aircraft encountered moderate turbulenceFootnote 7 when it was approximately 6.1 nm from the threshold of Runway 06, descending through 2480 feet. A few seconds later, the maximum landing gear extended speed (VLE) of 172 KCAS was exceeded. The PF disconnected the autopilot, immediately levelled off, and, once the airspeed decreased to 160 KCAS, resumed the descent.
During the turbulence encounter, the PF felt a sudden change in elevator force and perceived this as a reduction of elevator control effectiveness. The crew did not declare an emergency during this event. Shortly after, the PF noticed that the TAIL advisory light for the outer left de-ice boot on the de-icing panel did not illuminate. Given the workload associated with the approach phase, the de-ice boot failure procedure indicated in the Quick Reference Handbook (QRH) was not performed at that time.
The turbulence decreased at 1903, as the aircraft descended through 1540 feet. The crew lowered the flaps to 5° at 1380 feet and further lowered the flaps to 15° at 970 feet.
JZA8964 landed normally at 1904 and taxied to the air terminal, where the passengers disembarked. The crew made no pilot weather report regarding turbulence or icing. Post‑flight examination of the aircraft showed that the critical surfaces and airframe were free of contaminants and ice. The crew tested the de-icing boot system and noticed an indication of a possible malfunction of the outer left de-ice boot.
1.2 Injuries to persons
Not applicable.
1.3 Damage to aircraft
The following morning, the de-icing boot system was tested on the ground by maintenance, and no malfunctions were found.
Company maintenance personnel also inspected the aircraft because it had been operated at a speed that was above the maximum landing gear extended speed. The inspection did not reveal any damage or malfunctions.
1.4 Other damage
Not applicable.
1.5 Personnel information
Records indicate that the flight crew was certified and qualified for the flight in accordance with existing regulations (Table 1).
| Pilot-in-command | First officer | |
| Pilot licence | Airline transport pilot licence (ATPL) | Commercial pilot licence (CPL) |
| Medical expiry date | 01 April 2016 | 01 April 2016 |
| Total flying hours | 14 200 | 1521 |
| Flight hours on type | 11 200 | 391 |
| Flight hours in the last 7 days | 22.5 | 23.6 |
| Flight hours in the last 30 days | 66.9 | 62.9 |
| Flight hours in the last 90 days | 180.7 | 116.6 |
| Flight hours on type in the last 90 days | 180.7 | 116.6 |
| Hours on duty prior to occurrence | 7 h 15 min | 7 h 15 min |
| Hours off duty prior to work period | 14 h 51 min | 14 h 51 min |
On the day preceding the occurrence flight, the crew flew a series of 5 flights, which ended at CYZV at approximately 2300. On the day of the occurrence, the crew reported to the airport at 1330 for the flight to CYUL. The crew had a rest period in compliance with the provisions of the Canadian Aviation Regulations (CARs). The crew had been on duty for approximately 7 hours and 15 minutes at the time of the occurrence. There is no indication that fatigue, due to either lack of sleep or health problems, played a role in the occurrence.
1.6 Aircraft information
Records indicate that the aircraft was certified, equipped, and maintained in accordance with existing regulations and approved procedures (Table 2). The aircraft was equipped with a weather radar system.
| Manufacturer | De Havilland (Bombardier) |
|---|---|
| Type, model and registration | DHC-8-102 |
| Year of manufacture | 1987 |
| Serial number | 079 |
| Certificate of airworthiness / flight permit issue date | 10 June 1987 |
| Engine type (number of engines) | Pratt and Whitney Canada – PW120A (2) |
| Propeller/Rotor type (number of propellers) | Hamilton Standard – 14SF-7 (2) |
| Maximum allowable take-off weight | 35 000 lb (15 876 kg) |
| Recommended fuel type(s) | Jet A, Jet A-1, Jet B |
| Fuel type used | Jet A |
1.6.1 Icing certification
The DHC-8-102 is certified in compliance with U.S. Federal Aviation Regulation 25.1419 for flight in icing conditions, subject to the aircraft being operated in accordance with the manufacturer's aircraft flight manual.
All transport category aeroplanes found in Canadian commercial service require a combination of tests and analysis to demonstrate satisfactory performance to the standard contained in Appendix C of Chapter 525 of the Airworthiness Manual. This standard, identical to Federal Aviation Regulations Part 25, Appendix C (icing design envelopes), represents the universally accepted standard for icing certification for all transport category aeroplanes.
Flight testing includes a 0gFootnote 8 pushover manoeuvre conducted with ice accumulation on the aircraft's tail, with both natural icing conditions and artificial ice shapes. The manoeuvre involves pushing the control column forward to lower the nose of the aircraft and increase the aircraft's descent rate. Requirements are to induce negative g in order to produce a negative angle of attack on the tailplane, with the goal being to demonstrate that the aircraft shows no evidence of tailplane stall characteristics. Throughout testing, the DHC-8-102 showed no evidence of tailplane stall characteristics.
1.6.2 Surface de-icing system
The DHC-8-102 has various systems installed to protect it from icing conditions. The aircraft is equipped with inflatable boots on the leading edges of the wings, inlets of the engine nacelles, and horizontal and vertical stabilizers. Using engine bleed air, the boots expand and break off ice accumulation.
The crew controls de-icing boot inflation via automatic or manual mode, and can monitor boot inflation by observing a series of green advisory lights, installed within a diagram of the aircraft located on the overhead panel (Figure 1). An illuminated green de-ice boot advisory light on the ice protection panel indicates that the associated boot is fully inflated.
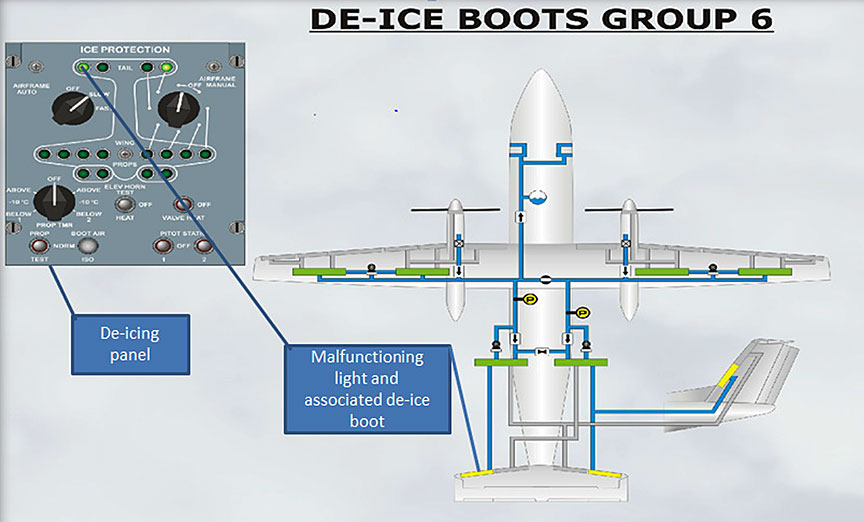
A pressure reading on the de-ice dual pressure indicator of 18±1 pounds per square inch (psi) indicates that the system is working normally. Should the pressure on either side fall below 5.5 psi, the DEICE PRESS caution light will illuminate. There is no indication that the DEICE PRESS caution light illuminated during the occurrence flight.
During the approach, shortly after the temporary difficulty with aircraft control, the PF noticed that the TAIL advisory light for the outer left de-ice boot on the de-icing panel did not illuminate. The exact time that the light stopped functioning could not be determined. Because the aircraft was established on final approach, and considering the workload associated with this critical phase of flight, the de-ice boot failure procedure indicated in the QRH was not performed at that time.
Wing inspection lights and 2 glare shield–mounted lights to illuminate windshield wipers can be used to inspect for ice accumulation. The crew monitored the de-icing system for proper operation as part of their scan during the approach, and did not notice any significant buildup on the wings or on the windshield wipers.
1.6.3 Tailplane stall
A tailplane stall can result from an ice-contaminated horizontal stabilizer. Generally, this will occur immediately after flap extension to an intermediate position or, more commonly, after extension from an intermediate position to the full-down position.
1.6.3.1 Tailplane stall symptoms
Usually, one or more of the following symptoms occurring during or after flap extension can indicate tailplane stall:
- Elevator control pulsing, oscillations, or vibrations*
- Abnormal nose down trim change*
- Any other unusual or abnormal pitch anomalies (possibly resulting in pilot induced oscillations)*
- Reduction or loss of elevator effectiveness
- Sudden change in elevator force (control would move nose down if unrestrained)
- Sudden uncommanded nose down pitch
* May not be detected by the pilot if autopilot is engaged.Footnote 9
1.7 Meteorological information
Environment Canada performed an in-depth analysis of the weather conditions affecting the CYYY area at the time of the occurrence. The following sections of the report are based on Environment Canada's analysis.Footnote 10
1.7.1 Synoptic overview
At 1300 on 03 February 2016, a major low-pressure system was centred northeast of Lake Huron. A warm front extended from the low-pressure system eastward into southern Quebec and was forecasted to move northeastward at 25 knots. Along and ahead of the warm front, some areas were already reporting freezing rain and ice pellets, and areas well ahead of the warm front (such as the Gaspé Peninsula, the Quebec north shore, and New Brunswick) were reporting light snow.
By 1900 on 03 February 2016, the low-pressure system was located over western Quebec and the warm front had moved slightly northward. Three aerodromesFootnote 11 were reporting ice pellets mixed with light snow, and the surface winds were still east-southeasterly ahead of the warm front.
1.7.2 Graphical area forecast
GFAs are issued 4 times daily, with a coverage period of 12 hours. Each issue is a collection of 6 charts: 2 charts valid at the beginning of the forecast period, 2 charts valid 6 hours into the forecast period, and the final 2 charts valid 12 hours into the forecast period. Two charts are issued for each specified time: 1 chart depicts cloud and weather conditions, and the other chart depicts icing, turbulence, and freezing-level conditions. Both charts depict forecast weather elements affecting flight at a specific time over a particular area.
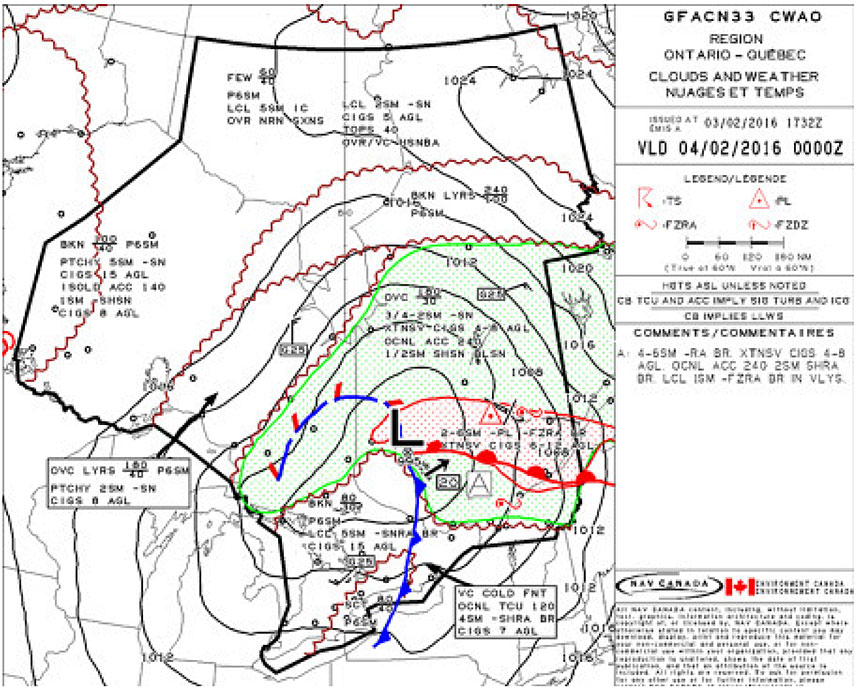
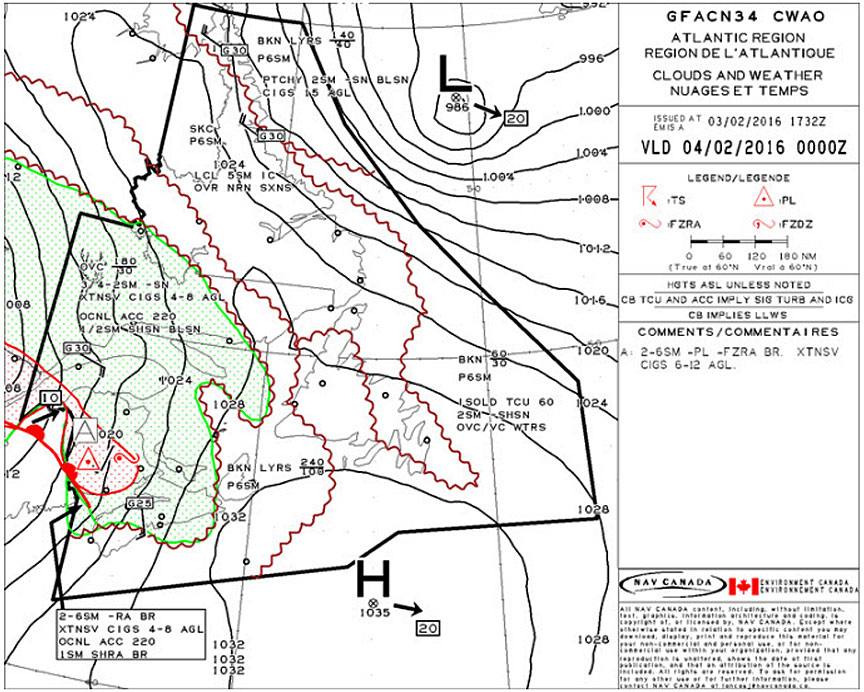
The clouds and weather chart issued at 1232, and valid at 1900, showed a low-pressure system located over southwestern Quebec, moving northeastward at 20 knots. See Appendix B for the clouds and weather charts issued on the occurrence date.
Ahead of the approaching system, the forecast called for
- overcast ceilings at 3000 feet, with tops at 18 000 feet;
- visibilities varying between ¾ and 2 statute miles (sm) in light snow;
- extensive ceilings between 400 and 600 AGL; and
- occasional altocumulus castellanus (ACC)Footnote 12 clouds with tops at 24 000 feet, reducing the visibility to ½ sm in snow showers and blowing snow.
The area ahead of the associated warm front approaching CYYY called for
- forecast visibility between 2 and 6 sm in light ice pellets;
- light freezing rain and mist; and
- extensive ceilings between 600 and 1200 AGL.
Behind the warm front, the following conditions were expected:
- visibility of 4 to 6 sm in light rain and mist;
- extensive ceilings between 400 and 800 feet AGL;
- occasional ACC with tops at 24 000 feet;
- visibility of 2 sm in rain showers and mist; and
- local visibility of 1 sm in light freezing rain and mist.
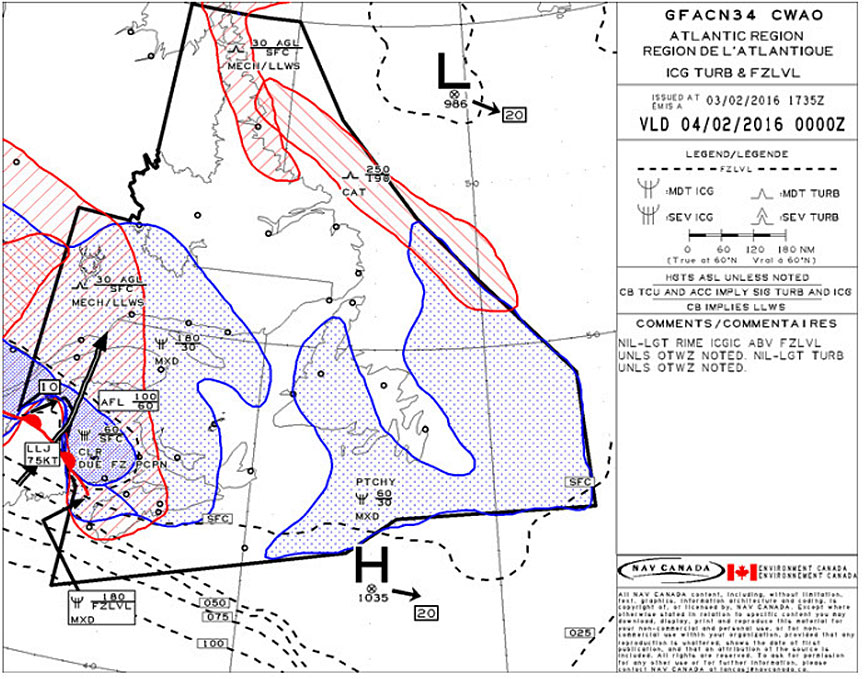
The icing and turbulence chart issued at 1232, and valid at 1900, depicted an area of severe clear icing along the warm front from the surface to 3000 feet with moderate mixed icing between 3000 and 18 000 feet ahead of this area. The area ahead of the warm front was also forecasted to have moderate turbulence due to mechanical and low-level wind shear between the surface and 5000 feet. A strong low-level jet with a south-southwesterly component and with a peak core speed of 75 knots was located east of CYYY. See Appendix B for the icing and turbulence charts issued on the occurrence date.
While descending for CYYY, the crew entered cloud just below 14 000 feet. No breaks were located afterwards and the crew described the clouds as being extremely dense. This weather system was anticipated to move northeastward at about 20 knots.
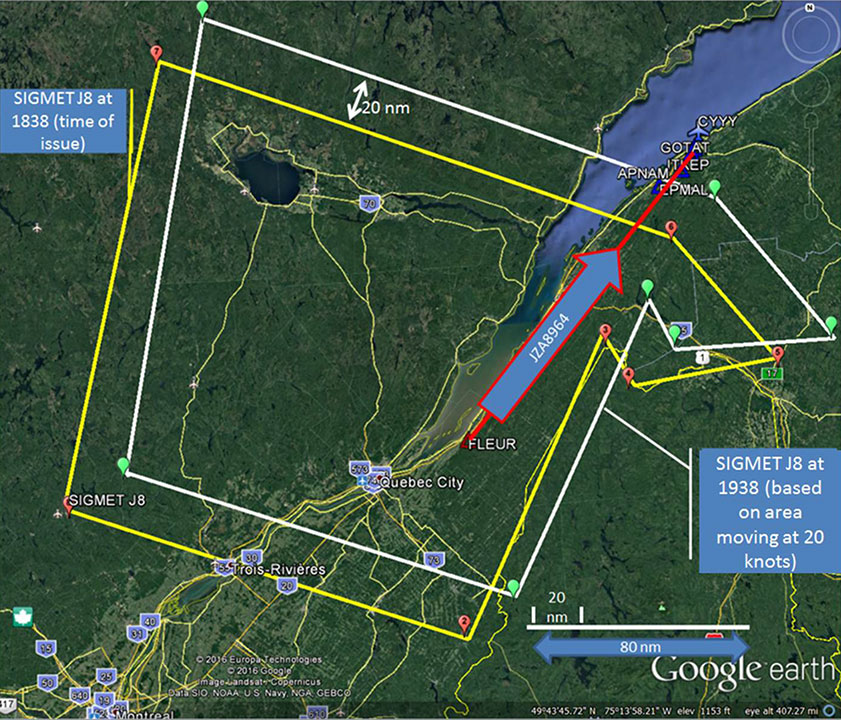
1.7.2.1 Significant meteorological information
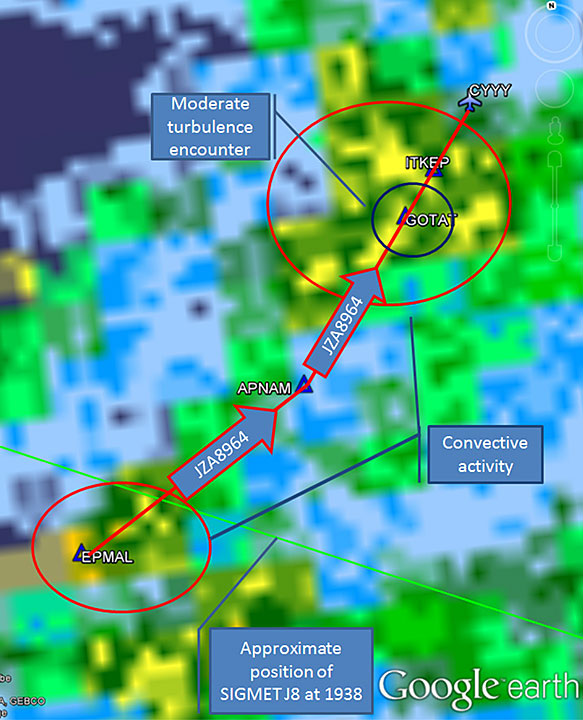
On the evening of the occurrence, the meteorological watch office issued SIGMET J8 at 1838 with a validity period starting at 1835. The SIGMET depicted an area of severe icing from the surface up to an altitude of 6000 feet. This area was forecast to move northeastward at a speed of 20 knots. Figure 2 shows the approximate location of the area of freezing rain and severe icing below 6000 feet AGL, as stated in SIGMET J8, when JZA8964 was approaching CYYY. See Appendix C for SIGMET J8 issued on the occurrence date.
1.7.2.2 Winds aloft
From data based on the upper-level wind and temperature forecasts valid at the time of the occurrence, forecast winds at 3000 feet were 190° true (T) at 49 knots, while Mont-Joli Airport was reporting winds from 130°T at 10 knots. From 3000 feet to the surface, this represents a 60° change in direction and a wind speed reduction of 39 knots.
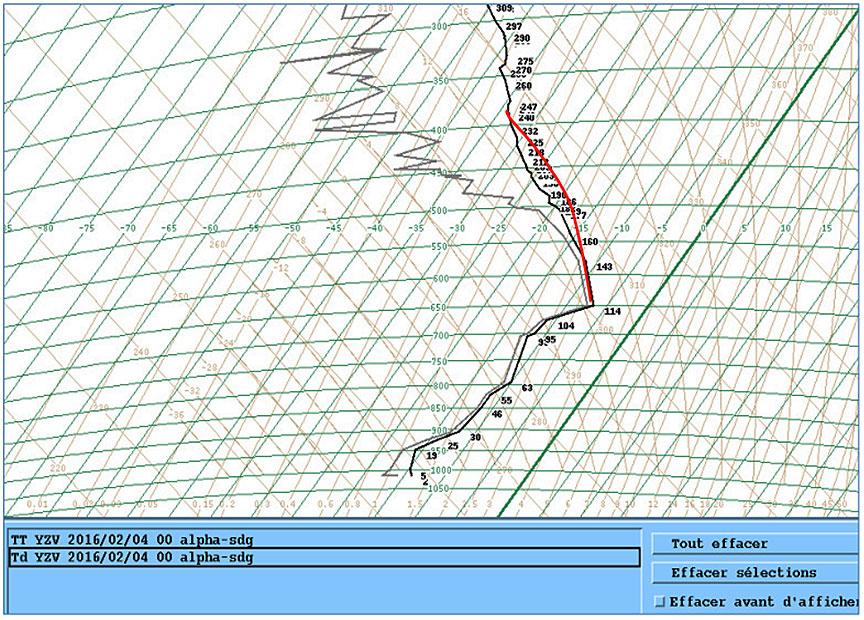
According to the Sept-Îles soundingFootnote 13 for 1900 on 03 February, there was a potential for low‑level wind shear ahead of the warm front since surface winds were southeasterly and winds aloft were southerly.
1.7.2.3 Low-level wind shear
A low-level jet stream is a sheet of strong winds some thousands of miles long, hundreds of miles wide, and hundreds of feet thick that forms above the boundary layer. It represents one of the different air motions found in the lower levels of the atmosphere, which may affect aircraft in the form of turbulence. Low-level jets are also one of the causes of hazardous low-level wind shear.
Wind shear is a change of wind speed and/or direction over a short distance, including updrafts and downdrafts. Wind shear can be caused by a prevailing wind encountering an atmospheric phenomenon or physical obstacle that produces a change in wind speed and/or direction.Footnote 14 If the change in wind pattern happens abruptly, there is a rapid change in an aircraft's airspeed. When the shear causes airspeed to increase, as a result of a rapidly increasing headwind or decreasing tailwind, the shear is classified as an increased performance shear.Footnote 15
1.7.3 Upper air soundings
The Sept-Îles tephigramFootnote 16 is the closest sounding representative of the air mass ahead of the warm front.Footnote 17 The 1900 sounding for 03 February 2016 revealed a saturated atmosphere from approximately 2000 feet to 18 000 feet. A wind shift in the lower levels from east to southwest was observed in the first 5000 feet. It also indicated a potential for ACC with tops reaching approximately 24 000 feet. The profile was fairly saturated as well, which indicated a potential for in-cloud icing from approximately 2000 feet to 18 000 feet.
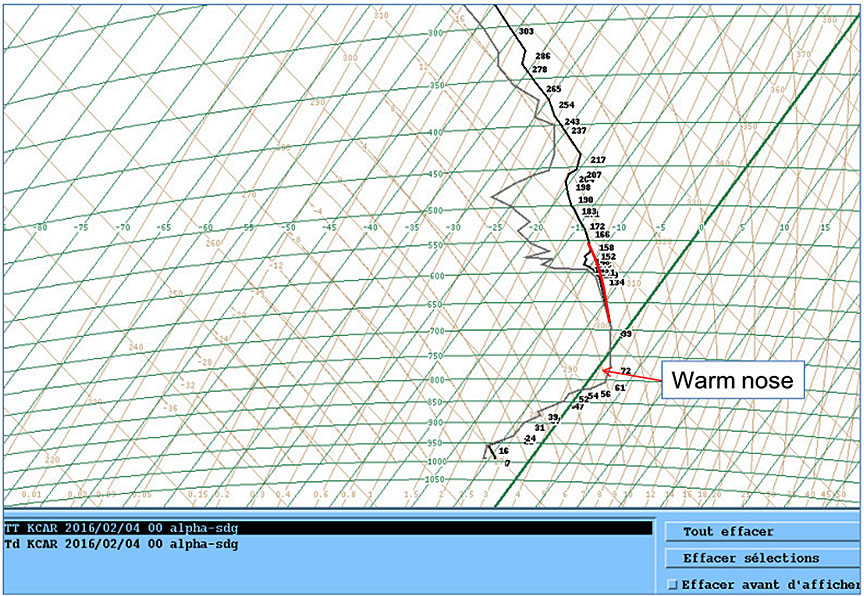
The Caribou tephigram is the closest sounding representative of the freezing precipitation near the warm front.Footnote 18 The 1900 sounding for 03 February 2016 revealed a saturated atmosphere from approximately 1500 feet to 15 000 feet, and a wind shift in the lower levels from southeast to southwest was observed in the first 3000 feet. The profile indicated a potential for ACC, with tops reaching 20 000 feet. An above-freezing layer was also present, along with a below-freezing layer underneath it. This was a good indication of freezing precipitation and the potential for severe clear icing. The Caribou sounding also showed strong 50- to 60-knot southerly winds at 4000 feet AGL. See Appendix D for upper air soundings issued on the occurrence date.
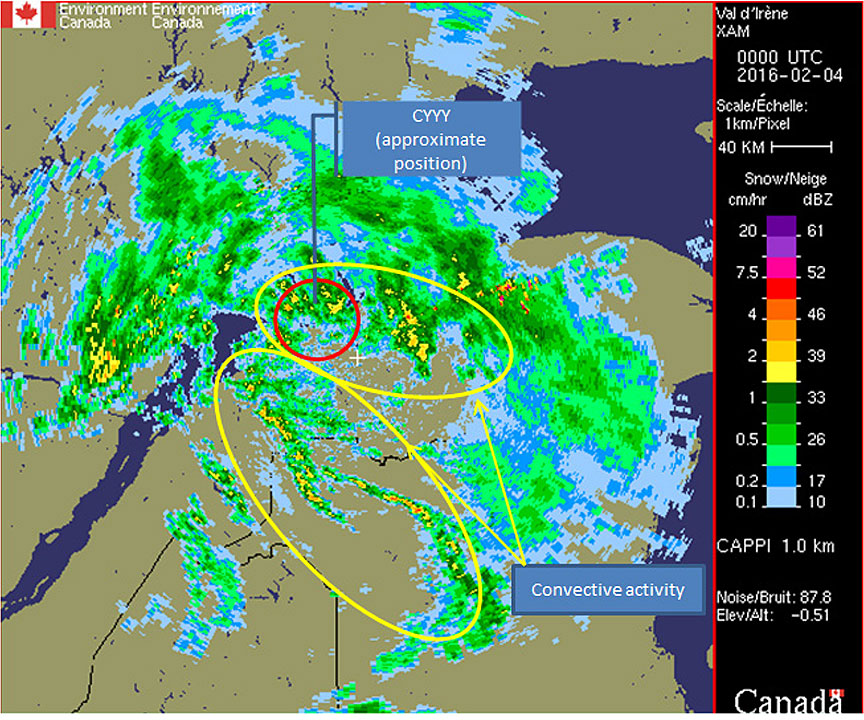
1.7.3.1 Weather radar
Data from the Val d'Irène, Quebec, weather radar, located approximately 24 nm southeast of CYYY, displayed precipitation bands sweeping over the Gaspé Peninsula between 1900 and 1940. In particular, the images showed 2 distinctive convective lines near Mont-Joli and to the southwest (Figures 3 and 4).

1.7.4 Mont-Joli aerodrome routine meteorological reports and aerodrome forecasts
Aerodrome routine meteorological reports (METARs) for CYYY are available 24 hours a day. The CYYY METAR issued at 1800 on 03 February 2016 reported wind 100°T at 8 knots, visibility 1¼ sm in light snow, cloud ceiling at 1800 feet AGL, temperature −8 °C, dew point −10 °C, and altimeter setting 29.96 inches of mercury.
At 1838, approximately 30 minutes before the aircraft landed, a special meteorological report (SPECI) was issued. It reported wind 130°T at 10 knots, visibility 3 sm in light snow and ice pellets, cloud ceiling at 1800 feet AGL, temperature −7 °C, dew point −10 °C, and altimeter setting 29.93 inches of mercury. The 1900 METAR, issued 4 minutes before the aircraft landed, remained similar with regard to visibility and type of precipitation.
Weather conditions remained steady for the next 2 hours, with precipitation changing from a mix of snow and ice pellets to ice pellets by 2100. CYYY first reported freezing rain at 2147.
Aerodrome forecasts (TAFs) provide a description of the most probable weather conditions for flight operations expected to occur, within a 5 nm radius around an aerodrome, and are amended when the forecast conditions are no longer representative of (i.e., they are better or worse than) the current or expected conditions. See Appendix E for the CYYY TAFs and METARs issued on the occurrence date.
The CYYY TAF issued at 1438 on 03 February, which was valid from 1500 until 0300 on 04 February 2016, indicated a prevailing visibility of 1 sm in light snow with an overcast ceiling at 1500 feet AGL. A temporary change to prevailing visibility and ceiling was forecasted for the period between 1500 and 1800, with visibility decreasing to ¾ sm in light snow and obscured ceiling at 800 feet AGL. A permanent change to prevailing visibility and ceiling was forecasted to occur as of 1800, when visibility was forecast to increase to 1½ sm in light snow and ice pellets with an overcast ceiling at 1000 feet AGL. Temporarily, for the period between 1800 and 2300, a prevailing visibility of 3 sm in light freezing rain and mist was forecasted to occur, with freezing rain changing into rain after 2300.
A first amended TAF was issued for CYYY at 1526, with a change to the prevailing visibility at the beginning of the period to 2 sm. At 1837, a second amended TAF was issued, while the aircraft was in flight. This second amendment changed, for a period between 1800 and 2200, the prevailing visibility to 3 sm in light snow and ice pellets with mist, and an overcast ceiling at 1000 feet. Freezing rain was now forecasted to begin after 2200.
1.8 Aids to navigation
Not applicable.
1.9 Communications
CYYY is an uncontrolled airport located in Class E airspace. It has a mandatory frequency (MF) area with a 5 nm radius around the airport, up to an altitude of 3200 feet. The Mont-Joli flight service station (FSS) provides information with respect to arrival, departure, and in-transit phases in the MF area.
1.9.1 Broadcast of significant meteorological information J8
In accordance with procedures outlined in NAV CANADA's Flight Services Manual of Operations, an FSS is to
[b]roadcast a SIGMET […] whenever any part of the area described in the SIGMET […] is within [their] area of responsibility, or could affect aircraft in [the] area of responsibility [of the FSS]. Broadcast shall be made on all frequencies except emergency frequencies for those areas affected:
A. immediately upon receipt; or
B. at the valid time of a forecast SIGMET.Footnote 19
The meteorological watch office issued SIGMET J8 at 1838. This SIGMET was valid from 1835 until 2235 on 03 February 2016, and affected an area up to 30 nm west of CYYY at the time it was issued.
At approximately 1858, Mont-Joli Radio broadcasted SIGMET J8 on the MF. The broadcast lasted approximately 90 seconds, during which time aircraft could not transmit on the frequency.
1.10 Aerodrome information
CYYY is located on the south shore of the St. Lawrence River, approximately 0.6 nm from the shoreline, and has 2 asphalt runways (Runway 06/24 and Runway 15/33). At the time of the occurrence, Runway 06 was in use and Runway 15/33 was closed for the winter. Runway 06/24 is 5000 feet long and 150 feet wide.
1.11 Flight recorders
1.11.1 Cockpit voice recorder
The aircraft was equipped with a cockpit voice recorder (CVR) with a rated recording time of 30 minutes. The CVR complied with the requirements of the CARs. The incident occurred at approximately 1901 and the aircraft landed at 1904.
The Jazz Company Operations Manual requires that the CVR circuit breaker be pulled after gate arrival on any flight leg during which an incident or accident has occurred.Footnote 20 However, the circuit breaker was not pulled after the occurrence flight and the CVR was not deactivated. Consequently, the conversations and sounds in the cockpit during approach and landing were overwritten.
The Transportation Safety Board Regulations in effect at the time of the incidentFootnote 21 state that any person having possession of or control over evidence must keep and preserve any evidence relevant to the incident. Following the occurrence, the PIC informed the company of the occurrence; however, the TSB was not notified until 09 February 2016—6 days after the event.
1.11.2 Flight data recorder
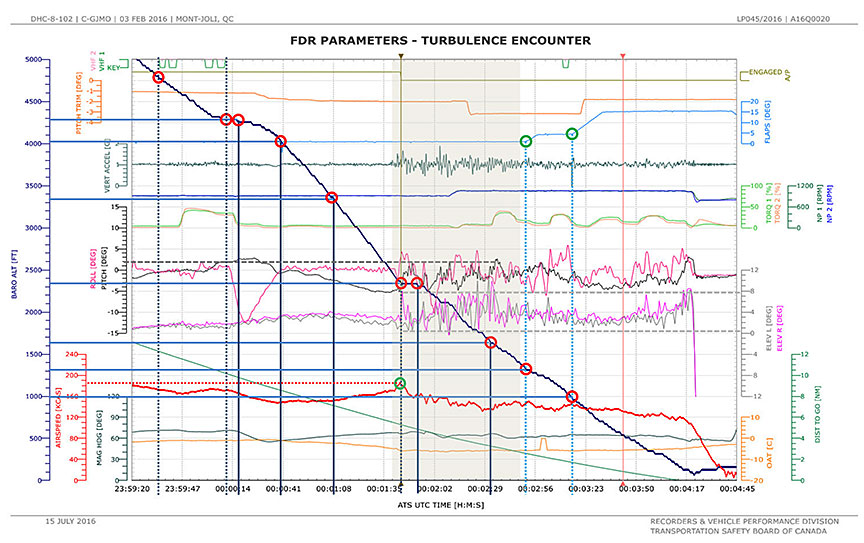
The aircraft was equipped with a flight data recorder (FDR). Once the PIC informed the TSB of the occurrence on 09 February 2016, further details were requested from the company. These details were provided on 12 February. Following the occurrence, the company downloaded the FDR for its internal investigation on 25 February. Following the analysis of these details, the TSB requested the FDR data file, which was sent to the TSB Engineering Laboratory on the same day for examination of recorded data. The FDR data file contained over 470 hours of recorded data,Footnote 22 including the occurrence flight on 03 February, from start-up at CYUL to shutdown at CYYY. FDR data applicable to the occurrence flight was forwarded to the manufacturer on 23 June 2016 for analysis.
Approach radar is not available at CYYY; however, enroute air traffic services radar data was available until 1858, as the aircraft descended through 6600 feet at 21 nm southwest of CYYY. The FDR data was synchronized with air traffic services communication recordings to establish a common UTC reference, as well as the aircraft's distance from the runway on final approach. Following are some of the key points during the approach.
Analysis of these data made it possible to establish the approach profile, determine the level of shear and turbulence encountered, and evaluate the aircraft response to control inputs (Table 3).
| Legend Start/end of icing conditions Start/end of turbulence encounter Start/end of VLE overspeed |
UTC Time |
Alt ASL (feet) |
Speed (knots) |
Est Dist (nm) |
|---|---|---|---|---|
| VHF* 1 – Start of discussion | 23:59:35 | 4770 | 172 | 12 |
| VHF* 1 – End of discussion | 00:00:10 | 4290 | 171 | 10.3 |
| Idle power | 00:00:16 | 4270 | 167 | 10.1 |
| Rollout on final | 00:00:40 | 4020 | 149 | 9.0 |
| Gradual pitch decrease (pitch −1.3°) | 00:01:00 | 3410 | 152 | 8.2 |
| Speed increase (pitch −2.5°) | 00:01:08 | 3340 | 152 | 7.8 |
| TAT** decreased to below 0°C | 00:01:32 | 2670 | 166 | 6.4 |
| Turbulence begins (pitch −5.4°) | 00:01:39 | 2480 | 171 | 6.1 |
| VLE overspeed (max) | 00:01:44 | 2360 | 185 | 5.8 |
| Autopilot off (speed VLE) | 00:01:44 | 2350 | 183 | 5.8 |
| Level off (vertical g 1.7) | 00:01:45 | 2340 | 180 | 5.8 |
| Below VLE (172k) | 00:01:47 | 2340 | 172 | 5.7 |
| Resume descent | 00:01:53 | 2320 | 163 | 5.4 |
| Max vertical g (1.9) | 00:02:05 | 2130 | 158 | 4.9 |
| Vertical g reduction | 00:02:14 | 2000 | 148 | 4.5 |
| Out of cloud (1800 AGL) | 00:02:15 | 1970 | 142 | 4.5 |
| Vertical g reduction | 00:02:40 | 1540 | 146 | 3.5 |
| Flap 5 | 00:02:49 | 1380 | 142 | 3.1 |
| 1000 AGL | 00:03:06 | 1170 | 134 | 2.4 |
| Flap 15 | 00:03:16 | 970 | 144 | 2.1 |
| 500 AGL | 00:03:34 | 670 | 136 | 1.4 |
| 50 feet | 00:04:11 | 210 | 117 | 0 |
| Landing | 00:04:21 | 142 | 101 | 0 |
* VHF: very high frequency.
** TAT: total air temperature.
The limited FDR parameters and low sampling rate (frequency of acquisition) result in snapshot-type recording in very dynamic conditions (moderate turbulence) that does not provide a real-time recreation of the event. For example, the FDR records pitch attitude and elevator position only every second, and does not record control column position or force.
Plots of the flight parameters were produced (Appendix F) to allow analysis of this reported difficulty with aircraft control, determining that
- prior to the event, the autopilot was engaged in VS mode;
- power was at idle during the event;
- from 1901:08 (3340 feet) to 1901:39 (2480 feet), there is a gradual decrease in pitch attitude, with an indicated airspeed increase from 152 KCAS to 171 KCAS;
- at 1901:44 (2350 feet), the autopilot was disconnected, there was a significant nose-up elevator input, and aircraft pitch increased immediately from −5° to 0°, with a vertical acceleration of 1.7g. The aircraft pitch then varied between −1° and +2° as the aircraft remained level at 2340 feet for 8 seconds;
- the aircraft's pitch oscillations were consistent with elevator movement, with no apparent disagreement between elevator displacement and aircraft pitch response;
- there was no evidence of any uncommanded nose-down pitch of the aircraft;
- there was no evidence of an elevator jam; and
- there was no departure from the intended approach profile, before or after the level‑off at 2340 feet.
Vertical g (turbulence data):
- between 1901:39 (2480 feet) and 1902:14 (2000 feet), the vertical acceleration varied between 0.4g and 1.9g;
- between 1902:14 and 1902:40 (1540 feet), the vertical acceleration varied between 0.6g and 1.4g;
- from 1902:40 (1540 feet) to landing, the vertical acceleration varied mostly between 0.8g and 1.3g.
1.11.2.1 Total air temperature calculation
As an aircraft flies through the air, it compresses the air, which causes the air temperature to rise. This is referred to as total air temperature (TAT). This temperature is generally used to establish the likelihood that ice will accumulate on the leading-edge surfaces of the aircraft. The simplified formula for this increase in temperature (T rise)Footnote 23 provides an approximate TAT for the different speeds on this occurrence approach as follows (Table 4):
| Legend Start/end of icing conditions VLE overspeed & A/P* off |
UTC Time |
Alt. ASL (feet) |
Speed (knots) |
OAT* (°C) |
T rise (°C) |
TAT (°C) |
|---|---|---|---|---|---|---|
| Descent | 23:54:48 | 10 200 | 172 | −4 | 3.9 | −0.1 |
| Descent | 23:54:56 | 10 100 | 178 | −3.9 | 4.2 | 0.3 |
| Descent | 23:55:01 | 10 000 | 182 | −3 | 4.4 | 1.4 |
| Rollout on final | 00:00:40 | 4020 | 149 | −1 | 2.9 | 1.9 |
| Gradual speed increase | 00:01:31 | 2720 | 164 | −3.6 | 3.6 | 0.0 |
| TAT decreased to below 0°C | 00:01:32 | 2670 | 166 | −3.8 | 3.6 | −0.2 |
| VLE overspeed & A/P off | 00:01:44 | 2360 | 185 | −5.8 | 4.4 | −1.4 |
| Out of cloud (1800 AGL) | 00:02:15 | 1970 | 142 | −6 | 2.7 | −3.3 |
| 500 AGL | 00:03:34 | 670 | 136 | −5.7 | 2.4 | −3.3 |
* A/P: autopilot.
** OAT: outside air temperature.
1.12 Wreckage and impact information
Not applicable.
1.13 Medical and pathological information
The investigation determined that there was nothing to indicate that the crew's performance was degraded by physiological factors.
1.14 Fire
Not applicable.
1.15 Survival aspects
Not applicable.
1.16 Tests and research
1.16.1 TSB laboratory reports
The TSB completed the following laboratory report in support of this investigation:
- LP045/2016 – FDR Data Analysis
1.17 Organizational and management information
1.17.1 Jazz Aviation LP
1.17.1.1 General
Jazz Aviation LP is a Transport Canada–authorized air operator that holds a valid air operator certificate. At the time of the occurrence, the company was operating a fleet of 116 aircraft, including 88 different DH8A, DH8C, and DH8D models of aircraft. These aircraft are operated according to CARs Subpart 705 (Airline Operations). The company has been compliant with requirements for a safety management system (SMS) under Part 1, Subpart 7, of the CARs since 2007.
1.17.1.2 Operational control
The company operates under a co-authority, complex, type A operational control system,Footnote 24,Footnote 25 which meets the regulatory requirements for Subpart 705 operation. Before the PIC accepts the operational flight plan and up to the point at which the brakes have been released for the purpose of take-off, the flight dispatcher and the PIC exercise joint operational control. The PIC confirms receipt and acceptance of the operational flight plan by signing the appropriate line of the aircraft journey log.Footnote 26Footnote 27
1.7.1.3 Stable approach criteria
According to the Jazz Dash 8 Aircraft Operating Manual, the factors required for an approach to be considered stabilized are as follows:
By 1000′ [feet above field elevation (AFE)]
- Landing gear extended
- The aircraft is on the correct lateral and vertical flight path (based on flight guidance or visual reference)
- Airspeed is trending towards the Target Speed of 120 [knots indicated airspeed (KIAS)], or the bugged approach speed, whichever is higher
- Normal descent rate is 500-800 [feet per minute (FPM)]. Descent rates shall not exceed 1000 FPM.
By 500′ [feet] AFE
- Landing gear extended
- Flap configured for landing (Flap 15 or Flap 35)
- The aircraft is on the correct lateral and vertical flight path (based on flight guidance or visual references)
- Stabilized airspeed is normally equal to the bugged approach speed
- Deviations of +10 knots to -5 knots are acceptable if the airspeed is trending toward bugged approach speed
- Normal descent rate is 500-800 FPM. Descent rates shall not exceed 1000 FPM.
- No turns shall be conducted below 500' AFE on approach and landing
- The power is stabilized to maintain the final approach speed along the desired approach path
Minimum Stabilization Heights (1000' [feet] AFE or 500' [feet] AFE)
If the approach is not stabilized at the minimum stabilization heights listed above, or becomes unstable when below the minimum stabilization heights, a go-around must be conducted immediately. Deviations of short duration are acceptable provided prompt corrections are made.Footnote 28
Based on these criteria, the occurrence approach was considered stable; the configuration was with flaps set at 15 degrees, power setting was stabilized, the airspeed was trending toward target, and the aircraft remained on its approach profile.
1.17.1.4 Reportable incident
According to subparagraph 2(1)(b)(iv) of the Transportation Safety Board Regulations, when "difficulties in controlling the aircraft are encountered owing to any aircraft system malfunction, weather phenomena, wake turbulence, uncontrolled vibrations or operation outside the flight envelope,"Footnote 29 the occurrence must be reported to the TSB.
Furthermore, as per section 2.7.17.1 of the Jazz Company Operations Manual, one example of a reportable incident is when "difficulties in controlling the aircraft are encountered owing to any aircraft system malfunction, weather phenomena, wake turbulence, uncontrolled vibrations or operations outside the flight envelope."Footnote 30
1.18 Additional information
1.18.1 Situational awareness
Situational awareness (SA) is defined as the perception of elements in the environment, the comprehension of their meaning, and the projection of their status in the future.Footnote 31 Several factors can influence these 3 levels of SA, such as expectations, information-processing mechanisms, and workload.Footnote 32 All 3 levels involve several stages of information processing where shortcomings may occur and that may result in incomplete or inadequate situational assessments. Mental workload and SA are intertwined, as both use and compete for the same limited information-processing capabilities. In some instances, a high workload can result in increased SA, while in other cases it can lead to a lower degree of SA.Footnote 33
A number of cognitive biases can impact how information is gathered or processed and how actions are taken. These biases can affect pilots' perceptions and actions. For example, confirmation bias creates a tendency to place emphasis on cues that support a pre-existing belief of the environment.Footnote 34
1.19 Useful or effective investigation techniques
Not applicable.
Analysis
2.1 General
Records indicate that the aircraft was certified, equipped, and maintained in accordance with existing regulations and approved procedures. There were no mechanical discrepancies found with the aircraft.
The flight crew was certified and qualified for the flight in accordance with existing regulations, and there were no indications that the flight crew's performance was in any way degraded because of physiological factors, such as fatigue.
Throughout the approach and landing, forecasted meteorological conditions were conducive to moderate turbulence and severe icing below freezing temperatures, as the aircraft was descending through a warm front with embedded altocumulus castellanus ACC and a low-level jet stream.
When the aircraft was approximately 6 nm from the runway threshold, moderate turbulence was encountered during which the landing gear extended speed (VLE) was exceeded. The pilot flying (PF) disconnected the autopilot and immediately performed a level-off to reduce the airspeed. During this moderate turbulence encounter, the PF felt a sudden change in elevator force and perceived this as a reduction of control effectiveness, which the PF later interpreted as a tailplane stall.
The aircraft was equipped with a functioning cockpit voice recorder (CVR); however, its recordings were not preserved, and data that could have been used for the investigation was lost.
Therefore, the analysis will focus on preservation of evidence, weather conditions, descent and approach, difficulty with aircraft control, and flight data recorder (FDR) data.
2.2 Reportable incident and preservation of evidence
According to subsection 8(1) of the Transportation Safety Board Regulations, "Every person having possession of or control over evidence relating to a transportation occurrence must keep and preserve the evidence unless the Board provides otherwise."Footnote 35 Shortly after landing, the pilot-in-command (PIC) reported the occurrence to the company. However, the occurrence was not reported to the TSB until 09 February 2016 by the PIC. If reportable occurrences are not reported to the TSB in a timely manner, perishable information may be lost, which could preclude the identification and communication of safety deficiencies to advance transportation safety.
Following the occurrence, the CVR circuit breaker was not pulled; therefore, these data were not preserved. Without CVR recordings, it was not possible to fully evaluate the following:
- crew communication;
- distraction level;
- workload management and task sharing; and
- overall situational awareness.
Consequently, it is possible that some safety deficiencies were not detected. Therefore, if cockpit recordings are not available to an investigation, this may preclude the identification and communication of safety deficiencies to advance transportation safety.
2.3 Weather conditions
During the flight from Sept-Îles Airport (CYZV), Quebec, to Montréal/Pierre Elliott Trudeau International Airport (CYUL), Quebec, the crew was preoccupied with the marginal weather conditions at CYYY. Upon arrival in CYUL, the PIC contacted dispatch to assess and discuss the viability of operating the flight to Mont-Joli Airport (CYYY), Quebec.
As the warm front was approaching CYYY, the forecast called for precipitation to change from light snow to light ice pellets and light freezing rain approximately 120 nm ahead of the front. As a result, within 120 nm of the warm front, moderate mixed icing was forecasted from 3000 feet to 18 000 feet and severe clear icing conditions were forecasted from the surface to 3000 feet. Significant meteorological information (SIGMET) J8 was issued at 1838, increasing the upper altitude of the severe icing area to 6000 feet. This area of severe clear icing was approaching CYYY from the southwest at 20 knots and forecasted to reach CYYY at 2038.
JZA8964 departed CYUL at 1757 and was scheduled to land at CYYY at 1915. Although the aircraft would descend through the warm front, the approach path (Figure 5) remained above the area of severe icing conditions and JZA8964 was scheduled to land at CYYY prior to the onset of the freezing precipitation.

2.4 Descent and approach
At 1837, the crew initiated the descent into CYYY and later performed a level-off at 14 000 feet, just above the tops of the clouds, to minimize the exposure to icing conditions. The presence of ACC is indicative of the presence of convective activity and, therefore, the potential for significant icing and turbulence with associated local visibility reducing to ½ sm in snow showers and blowing snow.
The crew was unaware of the presence of convective activity on approach and did not use the weather radar because they did not think that convective activity was a factor during the occurrence flight (Figure 6). Therefore, if crews do not use the weather radar near frontal activity with embedded ACC, there is a risk that convective activity will not be detected and aircraft may be flown into conditions that could affect the safety of the flight.
2.4.1 Icing
Throughout the descent below 14 000 feet, the flight experienced light to moderate mixed icing in cloud. The crew used the wing inspection and glare shield lights to monitor for icing. The system appeared to be functioning normally, even though, shortly after the reported difficulty with aircraft control, the PF noticed that the TAIL advisory light for the outer left de-ice boot did not illuminate.
The aircraft overflew the edge of the SIGMET J8 area, located approximately 20 nm from CYYY, as it was descending through 7800 feet, therefore avoiding the forecasted area of severe icing.
Analysis of the FDR data showed that the total air temperature (TAT) remained above freezing in the warm air aloft during descent from approximately 10 000 feet to 2720 feet. The reported cloud base at CYYY was 1972 feet (1800 feet AGL). Therefore, the aircraft flew in potential icing conditions from 2720 feet to 2350 feet, which is when the difficulty with aircraft control was noted. The aircraft flew out of potential icing conditions at 1972 feet. During the last part of descent in the cold air below the warm front, the temperature decreased from 0°C at 2720 feet to −7°C on the ground.
Considering that the aircraft flew in potential icing conditions for 12 seconds before the autopilot was disconnected and the temporary difficulty with aircraft control occurred, it is unlikely that airframe icing was present. Furthermore, the period of flight in potential icing conditions totalled 43 seconds, and ice accumulated during this period would have remained on the aircraft until after the aircraft landed in the colder air. Since no trace of ice was found on the aircraft when it was inspected after landing, it can be concluded that the aircraft did not encounter significant ice accumulation while on approach.
2.4.2 Significant meteorological information transmission over the radio
At 1855, JZA8964 contacted the CYYY flight service station (FSS) and reported being 12 nm from the EPMAL fix, on the area navigation approach for Runway 06. In order to minimize the exposure to icing and turbulence, the crew planned to fly a steeper descent.
At 1856, the FSS asked JZA8964 if they had received SIGMET J8 and the crew confirmed having the information. Approximately 2 minutes later, the FSS transmitted the contents of SIGMET J8 in both French and English. This transmission lasted 90 seconds. The PF communicated with the FSS about the distraction caused by this transmission while the aircraft was just about to turn final at 12 nm.
Although procedurally required by the FSS Flight Services Manual of Operations, such broadcasts may introduce a potential source of distraction during the approach while preventing any other communication on the frequency.
Because human attentional resources are limited, high-priority tasks may be delayed or dropped when a well-established sequence is interrupted by an unexpected external event. Therefore, if long SIGMETs are transmitted on the frequency while flight crews are in a high‑workload phase of flight, they may disrupt the performance of high-priority tasks.
2.4.3 Turbulence, wind shear, and landing gear extended overspeed
Radar images confirmed the presence of convective activity (ACC) approximately 10 nm west of CYYY as the aircraft was turning final at approximately 4300 feet.
The tephigram soundings confirm the presence of the low-level jet in the vicinity, with a 50‑ to 60‑knot southwesterly wind at 4000 feet, while the surface wind was southeast at 10 knots.
As the aircraft descended from 3340 feet to 2350 feet on final, the autopilot was engaged in vertical speed (VS) mode and power was set at idle. During that time, the airspeed increased from 150 KCAS (knots calibrated airspeed) to 171 KCAS, and FDR data shows a gradual decrease in pitch attitude as the autopilot maintained the set VS. This increase in speed was the result of an increased performance shear caused by the diminishing tailwind component. This is consistent with the aircraft flying out of the low-level jet.
At 2480 feet, the aircraft encountered moderate turbulence. The FDR data confirmed a sudden increase in aircraft oscillations, vertical acceleration up to 1.5g, and an abrupt 15‑knot increase in airspeed in 2 seconds, leading to the VLE overspeed to a maximum of 185 KCAS. No power change was observed during this period. Therefore, it can be concluded that the VLE overspeed occurred because the aircraft encountered significant increased performance shear while flying out of a low-level jet with the autopilot engaged in vertical speed mode.
2.5 Difficulty with aircraft control
When the VLE overspeed was noticed, the PF disconnected the autopilot and performed an immediate level-off to reduce the speed by applying significant nose-up elevator input. The aircraft pitch went from approximately −5° to 0°, resulting in a vertical acceleration of 1.7g. The aircraft maintained an altitude of 2340 feet for approximately 8 seconds as the speed reduced from 185 KCAS to 163 KCAS. The descent resumed at a speed of approximately 160 KCAS with power still set at idle. (Table 5)
| Legend Start/end of turbulence encounter Start/reduc./end of VLE overspeed |
UTC Time |
Alt. ASL (feet) |
Speed (KCAS) |
Est. dist. (nm) |
|---|---|---|---|---|
| Turbulence begins (pitch −5.4°) | 00:01:39 | 2480 | 171 | 6.1 |
| VLE overspeed (max) | 00:01:44 | 2360 | 185 | 5.8 |
| Autopilot off (speed VLE) | 00:01:44 | 2350 | 183 | 5.8 |
| Level off (vertical g 1.7) | 00:01:45 | 2340 | 180 | 5.8 |
| Below VLE (172k) | 00:01:47 | 2340 | 172 | 5.7 |
| Resume descent | 00:01:53 | 2320 | 163 | 5.4 |
| Max vertical g (1.9) | 00:02:05 | 2130 | 158 | 4.9 |
| Vertical g reduction | 00:02:14 | 2000 | 148 | 4.5 |
| Out of cloud (1800 AGL) | 00:02:15 | 1970 | 142 | 4.5 |
| Vertical g reduction | 00:02:40 | 1540 | 146 | 3.5 |
During the first 35 seconds of this moderate turbulence encounter, the vertical acceleration varied between 0.4g and 1.9g. The turbulence then reduced in intensity, to become light 26 seconds later with vertical acceleration that varied between 0.8g and 1.3g until landing.
2.6 Flight data recorder data
The FDR data were analyzed in an attempt to explain the PF's reported difficulty controlling the aircraft. Specifically, the FDR data were analyzed to evaluate the aircraft's response to control inputs to determine if the aircraft encountered an elevator jam, a reduction of elevator control effectiveness, or a tailplane stall.
2.6.1 Elevator jam
The limited FDR parameters do not include control column position or force and, therefore, do not allow for ruling out an elevator jam with FDR data exclusively. However, the FDR data shows considerable elevator movement, the PM observed control column movement, and the PF did not perceive any blockage of the elevator. Therefore, it is unlikely that an elevator jam occurred.
2.6.2 Aircraft response to control inputs
During the approach, the PF noticed that the TAIL advisory light for the outer left de-ice boot did not illuminate. Therefore, it is possible that the de-icing boot on the outboard section of the left horizontal stabilizer did not fully inflate. However, the investigation concluded that the aircraft did not encounter significant ice accumulation while on approach (see Section 2.4.1).
Throughout the event, there is no indication of an unintended departure from the approach profile. The initial elevator-up control input to level the aircraft when the VLE overspeed was noticed is apparent on the FDR and is followed immediately by an increase in pitch attitude, with a simultaneous g increase to 1.7g, and a level-off at 2340 feet.
Although the FDR recording does not provide a real-time aircraft reaction in pitch to elevator movement during this moderate turbulence event, the FDR data shows pitch oscillations consistent with elevator movement, with no apparent disagreement between control inputs and aircraft response: for example, full up elevator position while the aircraft continues to pitch nose down. Therefore, since there is no disagreement between the elevator position and the aircraft response to control inputs, it can be concluded that no elevator control issues occurred during this event.
2.6.3 Tailplane stall
Generally, tailplane stall is encountered immediately following flap extension with an ice‑contaminated horizontal stabilizer. During the certification process of the DHC-8-102, the aircraft did not exhibit any tailplane stall characteristic with ice accumulation on the aircraft's tail. Both the TSB Laboratory and the manufacturer's analysis of the FDR data determined that there was no indication of an ice-induced tailplane stall.
During this reported difficulty with aircraft control, the aircraft did not encounter significant icing, flap configuration was not changed, and the procedure for recovery was not applied. In addition, FDR data does not show an uncommanded nose-down pitch, and the aircraft's response was consistent with elevator control input. Therefore, analysis of the weather conditions, aircraft configuration, and FDR data confirm that a tailplane stall did not occur.
2.6.4 Aircraft response to environmental conditions
The weather conditions prior to the moderate turbulence were conducive to an increased performance shear, and the FDR confirms this with a progressive reduction in pitch (over 31 seconds) to maintain a fixed vertical speed.
The FDR data also confirms the sudden onset of moderate turbulence followed by immediate aircraft response to the elevator input to level the aircraft at 2340 feet. The FDR data further established that
- there was no elevator jam;
- there was no unintended departure from the approach profile;
- pitch oscillations were consistent with elevator movement; and
- there was no apparent disagreement between control inputs and aircraft response.
Although the FDR data depicts numerous and abrupt elevator movements during the moderate turbulence encounter, the aircraft remained on the intended approach profile during this event. The convective activity, combined with the significant shear in speed and direction, as the aircraft flew out of the low-level jet, resulted in the moderate turbulence during this event. Therefore, the investigation concluded that the combination of turbulence and shear contributed to the temporary difficulty with aircraft control effectiveness on approach.
2.7 Perception related to elevator control effectiveness
Analysis of the FDR data did not reveal any elevator control issues to explain why this experienced DHC-8 pilot perceived difficulty with aircraft control. Therefore, the investigation also looked at how human perception may be influenced by circumstances such as those in which this approach was performed.
The PF was expecting significant icing conditions on approach, not convective turbulence combined with shear turbulence with an increased performance shear. In addition, the PF had noticed a potential issue with part of the tailplane de-ice boot system and, therefore, possibly had a preconception of tailplane ice accumulation.
The PF was distracted by radio transmissions on the frequency and his subsequent discussion with the FSS. Shortly thereafter, the moderate turbulence encounter began, the VLE overspeed occurred, and the PF disconnected the autopilot. The PF's workload increased significantly as he manually levelled the aircraft to reduce the airspeed rapidly.
The PF was focused on rapidly reducing airspeed while in moderate turbulence and high on approach in tailwind conditions. Such a high workload can negatively affect situational awareness and perception as the limited human attentional capacity becomes more fully engaged by a primary task: in this case, reducing airspeed. A high-workload situation with a narrowing of attention may alter the perception of reaction times to control input.
Also, the numerous elevator movements observed on the FDR during the event may have been pilot-induced, but may also have been amplified in part by the effect of the moderate convective turbulence on the elevator surface, thereby changing the sensation on the control column. These changes in feedback on the control column, combined with attention narrowing, may have contributed to the PF's perception of reduced elevator control effectiveness. Therefore, it is likely that the expectation of significant icing, high workload, moderate turbulence, and attention narrowing contributed to the PF's perception that a reduction of elevator control effectiveness had occurred.
In hindsight, the PF concluded that a tailplane stall had occurred. Numerous elevator oscillations, combined with possible changes in feedback on the control column, can be symptomatic of tailplane stall. However, in general, tailplane stalls occur during flap configuration changes and with significant icing of the tailplane. In this occurrence, there was no significant ice accumulation on the aircraft, flaps were lowered after the event, and the FDR data analysis concluded that a tailplane stall did not occur.
3.0 Findings
3.1 Findings as to causes and contributing factors
- The landing gear extended overspeed occurred because the aircraft encountered significant increased performance shear while flying out of a low-level jet with the autopilot engaged in vertical speed mode.
- The combination of turbulence and shear contributed to the temporary difficulty with aircraft control effectiveness on approach.
- It is likely that the expectation of significant icing, the high workload, moderate turbulence, and attention narrowing contributed to the pilot flying's perception that a reduction of elevator control effectiveness had occurred.
3.2 Findings as to risk
- If reportable occurrences are not reported to the TSB in a timely manner, perishable information may be lost, which could preclude the identification and communication of safety deficiencies to advance transportation safety.
- If cockpit recordings are not available to an investigation, this may preclude the identification and communication of safety deficiencies to advance transportation safety.
- If crews do not use the weather radar near frontal activity with embedded altocumulus castellanus, there is a risk that convective activity will not be detected and aircraft may be flown into conditions that could affect the safety of the flight.
- If long significant meteorological information messages are transmitted on the frequency while flight crews are in a high-workload phase of flight, it may disrupt the performance of high-priority tasks.
3.3 Other findings
- The aircraft did not encounter significant ice accumulation while on approach.
- Since there is no disagreement between the elevator position and the aircraft response to control inputs, it can be concluded that no elevator control issues occurred during this event.
- Analysis of the weather conditions, aircraft configuration, and flight data recorder data confirm that a tailplane stall did not occur.
4.0 Safety action
4.1 Safety action taken
The Board is not aware of any safety action taken following this occurrence.
This report concludes the Transportation Safety Board of Canada's investigation into this occurrence. The Board authorized the release of this report on . It was officially released on .
Appendices
Appendix A – Approach data
Appendix B – Graphical area forecast
Clouds and weather
Icing and turbulence

Appendix C – Significant meteorological information J8
Significant meteorological information (SIGMET) J8
WSCN25 CWAO 032338
CZUL SIGMET J8 VALID 032335/040335 CWUL-CZUL MONTREAL FIR SEV ICG (FZRA) FCST WTN /N4639 W07354/60 W CYRQ - /N4550 W07037/45 NE CYSC - /N4728 W06913/60 W CYSL - /N4712 W06903/45 W CYSL - /N4714 W06743/5 NE cysl - /N4802 W06833/30 SW CYYY - /N4916 W07300/60 NW CYRJ - /N4639 W07354/60 W CYRQ SFC /FL060 MOV NE 20KT NC RMK GFACN34 GFACN33/CZQM MONCTON FIR SIGMET R2
Appendix D – Tephigram soundings
Appendix E – Mont-Joli Airport (CYYY) aerodrome forecasts and aerodrome routine meteorological reports
CYYY aerodrome forecasts (TAFs)
03 February 2016
CYYY 031338Z 0314/0402 13008KT P6SM FEW015 SCT030 OVC140 TEMPO 0314/0315 3SM -SN OVC015 FM031500 12010KT 2SM -SN BKN020 OVC025 TEMPO 0315/0317 6SM -SN OVC025 FM031700 12010KT 1SM -SN OVC012 TEMPO 0321/0401 3/4SM -SN VV006 FM040100 12010KT 2SM -SNPL OVC010 RMK NXT FCST BY 032000Z=
AMD CYYY 031548Z 0315/0402 14010KT 11/2SM -SN OVC020 TEMPO 0315/0317 2SM –SN OVC025 FM031700 12010KT 1SM -SN OVC012 TEMPO 0321/0401 3/4SM -SN VV006 FM040100 12010KT 2SM -SNPL OVC010 RMK NXT FCST BY 032000Z=
AMD CYYY 031629Z 0316/0402 12010KT 1SM -SN OVC012 TEMPO 0316/0401 3/4SM -SN VV006 FM040100 12010KT 2SM -SNPL OVC010 RMK NXT FCST BY 032000Z=
AMD CYYY 031822Z 0318/0402 10010KT 3/4SM -SN VV008 TEMPO 0318/0324 1SM -SN OVC012 FM040000 12010KT 11/2SM -SNPL OVC010 TEMPO 0400/0402 3SM -FZRA BR RMK NXT FCST BY 032000Z=
CYYY 031938Z 0320/0408 09008KT 1SM -SN OVC015 TEMPO 0320/0323 3/4SM -SN VV008 FM032300 12010KT 11/2SM -SNPL OVC010 TEMPO 0323/0404 3SM -FZRA BR FM040400 16012KT P6SM OVC015 TEMPO 0404/0408 5SM -RA BR RMK NXT FCST BY 040200Z=
AMD CYYY 032026Z 0320/0408 09008KT 2SM -SN OVC015 TEMPO 0320/0323 3/4SM -SN VV008 FM032300 12010KT 11/2SM -SNPL OVC010 TEMPO 0323/0404 3SM -FZRA BR FM040400 16012KT P6SM OVC015 TEMPO 0404/0408 5SM -RA BR RMK NXT FCST BY 040200Z=
AMD CYYY 032317Z 0323/0408 11008KT 11/2SM -SN OVC015 TEMPO 0323/0403 3SM -SNPL BR OVC010 FM040300 16010KT 11/2SM -SNPL OVC010 TEMPO 0403/0405 3SM -FZRA BR FM040500 19008KT P6SM OVC015 TEMPO 0405/0408 5SM -RA BR RMK NXT FCST BY 040200Z=
04 February 2016
CYYY 040143Z 0402/0414 11010KT 3SM -SNPL BR OVC020 TEMPO 0402/0403 11/2SM -SN
OVC010 FM040600 19008KT P6SM OVC015 TEMPO 0406/0409 2SM -RA BR OVC008
FM040900 20010KT P6SM -SHRA BKN070 FM041200 21015G25KT P6SM BKN070 BECMG 0412/0414 24015G30KT RMK NXT FCST BY 040800Z=
CYYY aerodrome routine meteorological reports (METARs)
03 February 2016
METAR CYYY 031800Z CCA 10009KT 5/8SM R06/3500FT/N -SN VV008 M10/M13 A3022 RMK SN8 /S02/ PRESFR SLP240=
SPECI CYYY 031821Z 07008G16KT 060V130 1SM R06/5500VP6000FT/U -SN OVC015 M10/M12 A3018 RMK SN5SC3 PRESFR SLP226=
METAR CYYY 031900Z 06008KT 1SM R06/5500VP6000FT/D -SN OVC015 M10/M12 A3015 RMK SN5SC3 /S01/ PRESFR SLP215=
METAR CYYY 032000Z 05006KT 010V110 1SM R06/6000FT/U -SN OVC015 M10/M12 A3010 RMK SN5SC3 /S02/ PRESRR SLP199=
SPECI CYYY 032009Z 08006KT 010V110 2SM -SN OVC020 M10/M12 A3008 RMK SC8 PRESFR
SLP193=
SPECI CYYY 032031Z 07005KT 1 1/4SM -SN OVC018 M09/M11 A3007 RMK SC8 PRESFR
SLP188=
METAR CYYY 032100Z 12010KT 1 1/4SM -SN OVC018 M08/M11 A3005 RMK SC8 /S04/
SLP183=
METAR CYYY 032200Z 12011G17KT 1 1/4SM -SN OVC018 M08/M10 A3001 RMK SC8 /S05/ PRESFR SLP167=
METAR CYYY 032300Z 10008KT 1 1/4SM -SN OVC018 M08/M10 A2996 RMK SC8 PRESFR SLP150=
SPECI CYYY 032338Z 13010KT 3SM -PLSN OVC018 M07/M10 A2993 RMK SC8 SLP141=
04 February 2016
METAR CYYY 040000Z 12011KT 3SM -PLSN OVC020 M07/M10 A2990 RMK SC8 /S07/ PRESFR SLP133=
METAR CYYY 040100Z 11009KT 3SM -PLSN OVC020 M06/M09 A2985 RMK SC8 SLP115=
METAR CYYY 040200Z 11008KT 10SM -PL OVC020 M05/M08 A2978 RMK SC8 PRESFR SLP091=
SPECI CYYY 040247Z 11007KT 6SM -FZRA OVC020 M04/M06 A2976 RMK SC8 PRESFR SLP082=
METAR CYYY 040300Z 11005KT 6SM -FZRA OVC020 M04/M06 A2975 RMK SC8 SLP079=
SPECI CYYY 040350Z 06007KT 15SM BKN018 M04/M05 A2972 RMK SC7 SLP070=
METAR CYYY 040400Z 08007KT 15SM BKN018 M03/M05 A2971 RMK SC7 PRESFR SLP066=
METAR CYYY 040500Z 05004KT 15SM BKN018 M03/M04 A2969 RMK SC7 SLP058=
METAR CYYY 040600Z 17002KT 15SM BKN018 M03/M04 A2966 RMK SC7 SLP048=
Appendix F – Flight data recorder data