Runway Overrun
Kelowna Flightcraft Air Charter Ltd.
Boeing 727-281, C-GKFJ
St. John's, Newfoundland and Labrador
The Transportation Safety Board of Canada (TSB) investigated this occurrence for the purpose of advancing transportation safety. It is not the function of the Board to assign fault or determine civil or criminal liability. This report is not created for use in the context of legal, disciplinary or other proceedings. See Ownership and use of content. Masculine pronouns and position titles may be used to signify all genders to comply with the Canadian Transportation Accident Investigation and Safety Board Act (S.C. 1989, c. 3).
Summary
On 16 July 2011, at 0645 Newfoundland Daylight Time, a Kelowna Flightcraft Air Charter Ltd. Boeing 727-281 (registration C-GKFJ, serial number 21455) operating as KFA228 departed Moncton International Airport, New Brunswick, for St. John's International Airport, Newfoundland and Labrador, on a scheduled cargo flight with 3 crew members on board. An instrument landing system approach was carried out and at 0809 Newfoundland Daylight Time the aircraft touched down on Runway 11. Following touchdown, the crew was unable to stop the aircraft before the end of the runway. The aircraft came to rest in the grass, with the nose wheel approximately 350 feet beyond the end of the pavement. There were no injuries and the aircraft had minor damage.
1.0 Factual information
1.1 History of the flight
Before departing, the crew carried out their pre-flight preparations, noting that the weather conditions at St John's included gusting winds, light drizzle and fog.
During the flight, the crew obtained the automatic terminal information service (ATIS) information Oscar and consulted the aircraft's landing performance table (Appendix B). Subsequently the crew decided to carry out an instrument landing system (ILS) approach to Runway 11.
At 0806,Footnote 1 the aircraft was established on the ILS glideslope and localizer for Runway 11. About 2 minutes later the crew acquired the runway visually through the light rain and selected the wipers on. The aircraft continued on the glideslope and at 0809 touched down about 1850 feetFootnote 2 beyond the threshold at between 157 to 162Footnote 3 knots.
Approximately 1 second after touchdown, the spoilers (speed brakes) were manually deployed. Reverse thrust was applied from about 7 seconds after touchdown to about 16 seconds after touchdown. Maximum wheel braking was applied about 8 seconds after touchdown, and almost immediately the crew noted the aircraft was skidding. The aircraft skidded left of centerline about 9 seconds later, about 5500 feet from the threshold.
The aircraft was not decelerating as expected and the crew determined that the aircraft would not stop in the remaining runway distance. The crew advised the NAV CANADA tower controller that the aircraft was going off the end of the runway. The tower controller sounded the crash alarm to signal airport rescue and firefighting services.
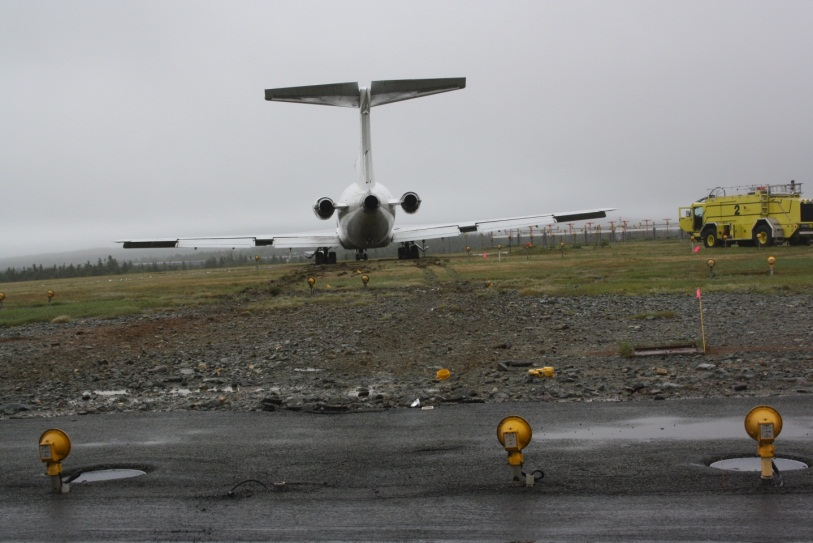
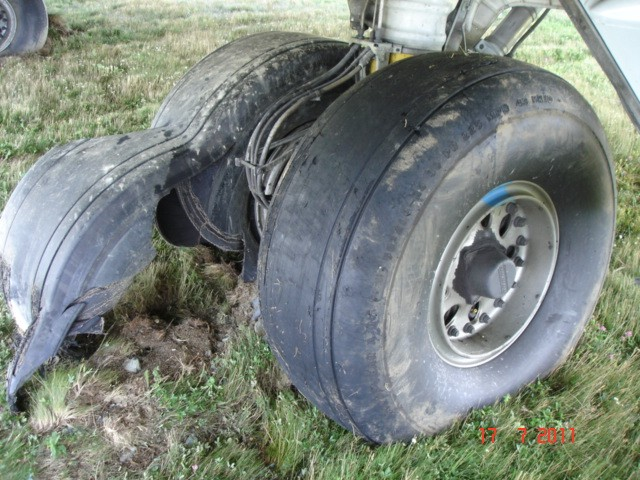
The aircraft remained left of centerline for approximately 2500 feet then rapidly crossed over to the right about 400 feet before the end of the paved surface. The crew was unable to stop the aircraft which departed the paved surface with the nose yawed about 13° left at approximately 40 knots. The aircraft came to a stop in the grass and mud, with the nose about 60 feet left of the extended runway centreline on a heading of 098° magnetic, approximately 48 seconds after touching down on Runway 11 (Photo 1). Maximum manual wheel braking was maintained throughout the entire landing roll.
After coming to a stop, the crew pulled the circuit breakers for the flight data recorder (FDR) and cockpit voice recorder (CVR) to preserve that information. The crew exited the aircraft by a company maintenance vehicle fitted with a work platform.
The St. John's airport rescue and firefighting services responded and were on-scene about 3 minutes after the alarm sounded. The firefighters confirmed that all 4 brakes were hot by utilizing a thermal imaging camera mounted on the crash vehicle and by a handheld thermal thermometer. As a precautionary measure they sprayed the main wheel and brake assemblies with foam. About 15 minutes after the foam was applied, the firefighters checked each of the brake's temperature and noted that they were about 200°F.
1.2 Injuries to persons
There were no injuries.
1.3 Damage to aircraft
The main landing gear doors, lower fairings, bottom surface of the aft inboard flaps, and aft lower fuselage had multiple dents and several punctures due to debris being thrown rearward from the main gear tires when the aircraft departed the runway surface. Engine number 1 inlet area was coated with dried mud and the low pressure compressor was damaged from ingesting debris. All 4 brakes had dirt and stones trapped within them, and the 4 main gear tires had multiple cuts, scrapes and patches of reverted rubber around their periphery. Both inboard tires also had large flat spots where the tire rubber had melted. While the aircraft was travelling through the overrun area, the 2 inboard tires burst at these flat spots. The aircraft came to rest with both of the flat spots against the ground.
1.4 Other damage
Numerous fragments of reverted rubber were recovered at various points along the runway, from just beyond the touchdown point until the runway end, mostly left of centerline. When the aircraft departed the end of the runway, it contacted 2 runway threshold lights and then struck lights in each of the next 3 rows of approach lighting. Additionally, an electrical box on the ground was destroyed and its internal wiring was damaged by the aircraft's right inboard tire.
The 2 inboard tires were hydroplaning, as evident by the steam cleaning marks, just before they departed the runway. Rubber debris, consistent with skidding tires, was noted on the asphalt portion of the runway end and the path that the 2 inboard tires left through the overrun area had multiple scuffed rocks with imbedded rubber residue and rubber debris. Additionally, the sod was torn up in numerous locations and the grass remained flattened along the path. The grass in the path of the 2 outboard tires remained upright and the sod was less damaged.
1.5 Personnel information
1.5.1 Flight crew members
Records indicate that the crew was certified and qualified for the flight in accordance with existing regulations.
| Captain | First officer | Second officer | |
|---|---|---|---|
| Licence | ATPL | ATPL | ATPL |
| Medical expiry date | 2012/03/01 | 2011/11/01 | 2012/02/01 |
| Total flying hours | 8688 | 2750 | 3400 |
| Hours on type | 6171 | 2500 | 2000 |
| Hours off duty prior to work | 36 | 18 | 23.5 |
The captain occupied the left seat and was the pilot flying. There was no indication that incapacitation or physiological factors affected the crew's performance. The investigation determined that fatigue was not a factor in this occurrence.
The crew had been into St. John's on multiple occasions.
1.6 Aircraft information
| Manufacturer | Boeing |
|---|---|
| Type and model | 727-281 |
| Year of manufacture | 1978 |
| Serial number | 21455 |
| Certificate of airworthiness | 15 April 2009 |
| Total airframe time/Cycles | 46 035.3 hours / 42 927 cycles |
| Engine type (number of) | Pratt & Whitney JT8D-17 (3) |
| Maximum allowable take-off weight | 194 800 poundsFootnote 4 |
| Maximum taxi weight | 195 500 pounds |
Records indicate that the aircraft was certified and maintained in accordance with existing regulations and approved procedures, and that there were no recorded deficiencies before the occurrence flight. The No.1 wheel assembly, part number 10-61287-14, was not identified on the Supplemental Type Certificate (STC)00925AT list of approved main landing gear wheel assemblies for aircraft operating up to 195 500 pound maximum taxi weight.Footnote 5
The aircraft's landing gear consists of 2 dual-wheel main gear and a dual-wheel nose gear. Each main gear is equipped with multi-disc hydraulic brakes. The hydraulic brake system is the normal braking system and is controlled by the captain's or first officer's rudder pedals.
The aircraft was equipped with an Allied Signal solid-state universal FDR (part number 980-4120-RXUS, serial number 4698) and a Fairchild solid-state CVR (model A100A, serial number 10060).
Maintenance of Kelowna Flightcraft Air Charter Ltd.'s (KFACL) aircraft is contracted to Kelowna Flightcraft Ltd. (KFL). These 2 companies are part of the Kelowna Flightcraft Group of Companies.
1.6.1 Main wheel and tires
The crew began their flight day in Hamilton, Ontario, with scheduled stops in Mirabel, Quebec, and Moncton, New Brunswick. In Hamilton and again in Mirabel, upon completing the preflight check, the second officer advised the captain that the tires appeared to display little tread and that 2 were nearly bald. On both occasions KFL's maintenance personnel advised the crew that the tires were serviceable. As a result, neither the flight crew nor the maintenance personnel reported the tire tread condition as a potential safety risk through the company's risk management system (RMS).
According to the Boeing 727 maintenance manual, and the KFL tire and wheels - general inspection check, tires are to be removed from service when the average tread depth is reduced to 0.031 inches (1/32 inches), or the tread carcass ply (bias tire) shows at any location, or the tread reinforcement ply shows at any location. KFL Technical Information NoticeFootnote 6 (TIN) ALL 03-04 states that a tire should NOT be replaced until these limitations are reached unless operational requirements dictate otherwise (i.e. aircraft operating away from base).
The investigation determined that measuring the tire tread depth was not a typical practice at KFL's maintenance bases.Footnote 7 If a tire had even some tread showing, it would generally be considered serviceable. The practice of releasing aircraft tires in this condition was considered normal and therefore was not being reported as a potential safety hazard through the company's RMS.
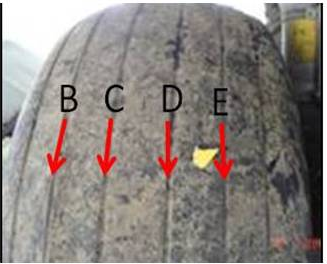
The TSB measured the remaining tire tread depth at each of the tire's circumferential groovesFootnote 8 (Photo 2). The average tread depth was determined by taking measurements at 12-inch intervals and dividing by the number of measurements (Table 1). The number 3 and 4 tires' tread depth was less than Boeing's specified limit.
The aircraft was equipped with 50X21Footnote 9 30-ply tires. The pressure of the No. 1 and No. 4 main landing gear tires was taken the day after the occurrence and the readings were 165 pounds per square inch (psi) and 177 psi respectively. These readings were within the required pressure of 170 psi +/− 5%.
| Groove | No. 1 tire | No. 2 tire | No. 3 tire | No. 4 tire | ||||||||
|---|---|---|---|---|---|---|---|---|---|---|---|---|
| Min | Max | Avg | Min | Max | Avg | Min | Max | Avg | Min | Max | Avg | |
| B | .173 | .252 | .210 | .225 | .255 | .240 | .119 | .162 | .142 | .109 | .136 | .125 |
| C | .106 | .172 | .150 | .010 | .120 | .050 | .002 | .027 | .018 | .000 | .065 | .012 |
| D | .124 | .175 | .153 | .008 | .125 | .060 | .004 | .065 | .034 | .000 | .042 | .009 |
| E | .143 | .174 | .158 | .150 | .200 | .175 | .153 | .183 | .168 | .132 | .184 | .150 |
1.6.2 MK III Anti-skid configuration
The occurrence aircraft was equipped with a Boeing MK III anti-skid system which prevents individual wheel skidding by limiting the hydraulic pressure applied to the brakes by the hydraulic system.Footnote 10 The pilot applies pressure through the brake pedals. Anti-skid valves, which operate independently of each other, continuously vary braking pressure in accordance with signals received from the anti-skid control unit.
Each wheel's rate of deceleration is compared with a preset rate. When decelerations are within this rate there is no correction signal. Wheel decelerations above this rate (wheel speed drops) are treated as skids and a correction signal is sent to the anti-skid valve to reduce applied brake pressure. The correction signal is reduced when the wheel deceleration rate returns to speed again. The anti-skid system continuously seeks a level of brake application to attain maximum braking efficiency.
The anti-skid system incorporates a locked-wheel detector circuit which provides a full brake release signal in the event of a locked wheel. The circuit controls either the inboard or outboard pair of main gear wheels. It is designed such that during landing with the landing gear lever in the down position before touchdown, the brakes are released, regardless of brake pressure applied by the pilot.
When the 2 wheels of mated pair spin up to 20 mph, the anti-skid brake system is available. Should 1 wheel of the mated pair drop below 10 mph, and the other remain at or greater than 20 mph, a full brake release signal is sent to the anti-skid control valve, releasing the brake pressure on the mated pair of wheels so that the anti-skid system will remain available.
1.6.3 Occurrence aircraft anti-skid system
After landing in Montréal, it was noted that the No. 4 brake was hotter than the other 3 brakes. In Moncton, it was noted that the No. 1 brake was hotter than the other 3 brakes, and that the 3 other brakes were about the same temperature.
Before returning the occurrence aircraft back into service after the overrun, KFL maintenance personnel replaced all 4 brake and main wheel assemblies then carried out an anti-skid test. During testing it was noted that, with the brake pedals depressed, the No. 4 brake was not activated. Additionally, when the locked-wheel function test was performed with the selector switch in left-outboard (LO) position, the meter did not respond correctly. Maintenance determined the anti-skid control unit was unserviceable. The unit was replaced and all testing was carried out without discrepancy.
The anti-skid control unit was forwarded to the TSB Laboratory for testing and further examination. Bench tests identified a defective No. 4 main wheel circuit board. The nature of the failure was that the control unit was continuously supplying a signal to the No. 4 brake control unit to release brake pressure. This type of failure was considered rare. Visual examination of the failed circuit board did not identify any discrepancies such as broken components or solder joints, indicating the damage was likely internal to a component. The design of the anti-skid system is such that this type of failure would not have caused the outboard anti-skid inoperative (INOP) amber caution light, located in the pilot's overhead panel, to illuminate.
1.6.4 Brake cooling
When the aircraft departed Moncton, the crew left the landing gear down for 5 minutes to aid in brake cooling.
In June 2011, KFACL issued a memo to all Boeing 727 pilots to review brake-use and brake-cooling procedures.
We are seeing more operations at higher landing weights and this has resulted in a rise in the occurrence of fuse plug releases on Boeing 727 main wheel assemblies with associated delays to the customer and increased maintenance costs.
I would also like to remind crews making a turnoff 6000' down a 12,000 foot runway cannot typically be accomplished with light braking and rollout to a later runway exit point is the better and safer option.
The memo advised pilots to be safety conscious and use available runway before brakes.
The memo also advised pilots that maintenance personnel would provide them with the temperature reading of the wheels/brakes and it instructed the pilots to consult the Boeing 727 Operations Manual and locate the brake-cooling schedule to determine a parking-brake cooling time. If the aircraft was scheduled to depart sooner than the determined brake-cooling time, then KFL allowed the aircraft to depart if the wheel temperatures were 225°F or less and an airborne gear-down cooling time of 5 minutes was observed.
The brake-cooling schedule provides specific cooling-time limits, or alternate gear-down cooling times, based on a number of landing characteristics such as gross weight, speed at which the brakes were applied, outside air temperature and a determination of the braking effort (light, moderate, heavy). The cooling schedule does not make reference to brake or wheel temperatures.
On 20 June 2011, KFL issued a separate memo to the line maintenance bases to provide guidance on what action should be taken concerning hot brakes/wheels. The memo provided some guidance as to how and where to take the temperatures; however, there was no TIN issued nor were there any published instructions. Therefore, detailed work instructions such as exactly where to take the temperature, at how many different locations, or at what distance from the wheel/brake the temperature measuring equipment (infrared thermometers) should be held were not included. The infrared thermometers were locally purchased items and were not calibrated to ensure the readings were accurate and consistent, and there was no requirement to record the measured brake/wheel temperatures. The memo provided guidance on what to do when the brakes are determined to be hot including any and all safe practices that can be used to reduce those temperatures.
These 2 memos identified that the fuse-plug releases were an issue that needed to be addressed; the associated risks had been informally assessed and mitigating procedures had been recommended.
The typical practice employed to cool the brakes was to release the parking brake and chock the tires. However, at some of the line bases, maintenance personnel had adopted a local practice which involved misting the wheel with water to aid in cooling. This method was not identified in the memo, nor was it a manufacturer's approved standard practice. It was employed as a means to ensure the brake temperatures were within the departure allowable limits. The information that this local practice had been put in place was not identified as a potential safety hazard for further assessment by the company RMS.
Boeing Maintenance Tip (MT) 727 MT 32-006, dated 18 July 2005, states:
Boeing does not recommend water or liquid cooling of wheels, tires, or brakes at any time, except as noted in Airplane Maintenance Manual (AMM) Chapter 5 following a high energy stop and only then after allowing the components to cool “naturally” for at least one hour. This one hour wait allows the wheel thermal fuse plugs to safely release tire pressure (if energies are high enough) and allows wheel, tire and brake equipment to begin to cool (maintenance personnel must continue to use caution when approaching or working near hot wheels, tires, and brakes).
Operators, especially those that operate numerous flights of the same airplane each day, have very short turn times, or operate at high-altitude hot airports, may find it beneficial to more actively “manage” their brake energy absorption and resulting brake temperatures.
Boeing encourages operators to “manage” brake temperatures whenever possible so ground based air cooling can be minimized. A Boeing Airliner article, “A Look at Brake Cooling”, published in July 1979, provides a good discussion on brake energy accumulation.
Boeing recommends maintenance, engineering, and flight operations personnel to review this Airliner article and the discussion in this Maintenance Tip (MT), especially if high brake temperatures are being experienced.
Each main wheel is equipped with a thermal fuse plug that will melt if the temperature of the wheel gets too high. The purpose of the fuse plug is to protect against an explosive release of tire nitrogen. Some of the hazards associated with the high brake temperatures could include brake/wheel fires, failure of the tire/wheel during taxi and/or take-off, and abnormal take-off procedure by leaving the gear down to cool the brakes. Each of these also includes its own set of risks, for example, fuse plug blowing causes the tire to deflate. If this happened during taxiing, then it is possible that the tire could be damaged and debris deposited on the runway could create a hazard for other aircraft. If the fuse plug blows during/after take-off, then the aircraft would, at a minimum, be landing with one flat tire thereby reducing the braking effectiveness, which in turn would increase the landing distance, and cause the other paired tire to support a greater weight.
Fuse-plug releases are not considered normal wear and tear. In accordance with KFL's procedures, these should be reported through the company's RMS. Between 01 January 2009 and 16 July 2011, there were 2 RMS reports related to fuse-plug releases. In August 2011, KFL carried out a reliability review for the period of January to August 2011 and identified 7 additional unique occurrences of fuse-plug releases, which had been reported through various maintenance procedures but not through the RMS.
1.7 Meteorological information
ATIS information Oscar issued at 0730:
Surface wind 210° Magnetic (M) at 14 gusting to 21 knots, visibility 2 statute miles in light rain and mist, overcast clouds at 500 feet above ground level, temperature 17°C, dew point 15°C, altimeter 29.91 inches of mercury, approach ILS runway 16, arrivals and departures runway 16.
The investigation determined from 2 independent sources that 0.3 mm (0.012 inches) of rain had fallen between 0800 and 0815. In the previous 45 minutes, these 2 sources recorded 1.3 mm and 1.0 mm (0.05 inches and 0.04 inches) of rain respectively.
Timely and accurate weather information helps crews determine airport suitability and landing performance.
At stations served by an automated weather observation system, a special report will be issued whenever heavy rain starts or stops. However, at stations where qualified observers report the weather, such as at St. John's, there is no similar requirement prescribed in Environment Canada's Manual of Observations (MANOBS). Nor is there a requirement in NAV CANADA's Air Traffic Control Manual of Operations (MANOPS) for controllers to advise a pilot when heavy rain starts or stops.
In 2010, NAV CANADA published Squawk 7700 - 2010-1 Landing Accidents and Runway Overruns, which reminded controllers that in bad weather, pilots need to receive timely information about runway surface conditions. At St. John's airport, if field personnel are aware of standing water on the airfield, they will normally advise the tower controller.
1.8 Aids to navigation
N/A
1.9 Communications
N/A
1.10 Aerodrome information
1.10.1 General
St. John's Airport has 3 asphalt runways (Appendix C – Aerodrome Chart). Runway 11/29 is 8502 feet long by 200 feet wide and Runway 11 has a 0.27% downslope. Runway 16/34 is 7005 feet long by 200 feet wide. Both runways are served by an ILS precision approach. Runway 11 has a 60-meter unpaved runway end strip. Runway 20/02 is 5028 feet long by 100 feet wide. None of the runways at St. John's Airport have a grooved surface or runway end safety area (RESA), nor are they required to by regulations.
Runway 11/29 has a transverse slope downward from the south to the north, and the wind direction at the time of landing would have assisted in water drainage.
As of 1 January 2008, all Group 1 airports in Canada including the St John's airport were required to begin implementing safety management systems (SMS). At the time of the occurrence, the St. John's International Airport Authority had completed implementing the requirements of Phase IVFootnote 11 of SMS implementation. However, it had not yet been subjected to Transport Canada's final program validation inspection of the entire SMS program.
1.10.2 Runway selection
Runway 16 was the designated active runway and with the wind direction and speed, the aircraft would have had an 11-knot headwind component and an 8-knot crosswind component. Landing on Runway 11 resulted in the aircraft having a 3-knot tailwind component and a 14-knot crosswind component. Based on the aircraft's landing weight and configuration, the aircraft's landing performance tables indicated that either runway was suitable for landing.
The captain was concerned that they may experience turbulence during the approach to Runway 16 and taking this into account decided to land on the longer Runway 11.
The actual fuel burn and weight and balance documents completed by the crew on the final leg could not be located after the occurrence. Therefore, based on the company dispatch calculations supplied to the crew and the landing fuel, weight was determined to be approximately 158 000 pounds. Landing distance calculations were carried out by TSB investigators using the weight and performance characteristics of the occurrence aircraft. It was determined that based on the target speed (1.17.3 KFACL Boeing Normal Procedures), the wet runway landing distanceFootnote 12 would be 5100 feet. This distance is consistent with Boeing's calculated total wet runway stopping distanceFootnote 13 for a Boeing 727-200 series aircraft in standard configuration at this weight and flaps set at 30°. Based on the TSB's maximum calculated landing speed (162 knots) the aircraft would have required an additional 500 feet of runway landing distance. Even using 5600 feet for landing distance, this would have given them approximately a 1000-foot buffer if touchdown occurred at 1850 feet.
1.10.3 Runway friction
Over time, the friction characteristics of a runway pavement deteriorate due to a number of factors such as mechanical wear, the polishing action of aircraft tires rolling or braking on the pavement and the accumulation of contaminants, primarily rubber from aircraft tires, on the pavement surface. Runway friction measurements are intended for use in detecting deterioration of friction characteristics and determining the need for and timing of corrective action to restore friction to acceptable levels.
Transport Canada (TC) requires airport operators to periodically measure the friction characteristics of the runway surface. TC leaves it up to the airport operators to conduct their own runway friction tests and establish the frequency of testing based on the unique history and circumstances of their site.
Transport Canada requires the runway surface test be carried out using a surface friction tester operating at 65 km/h under self-wetting conditions at 0.5 mm water depth. ICAO and the FAA identify a test water depth of 1.0 mm.Footnote 14 In 1995, TC carried out a runway friction monitoring test to compare the coefficient of friction levels (in units from 0 to 100) measured using 0.5 mm and 1.0 mm water depths.Footnote 15 The test concluded:
An increase in water depth to 1.0 mm would increase the testing time required at each airport as more frequent trips would be required to/from the runways to refill the water tank. Program cost and airport operational disruptions would likewise increase. For these reasons and the fact that a 1.0 mm water depth would only lower friction results by 2 or 3 units, it is recommended that Transport Canada continue with the current practice of using a 0.5 mm water depth for friction testing to simulate “normal wet” conditions.
Runway-friction testing was carried out at St. John's Airport by an independent contractor in October 2010. The average runway-friction numbers for testing, done in accordance with TC requirements, ranged from a coefficient of .70 to .87. These results were defined as well above the TC maintenance planning level friction coefficient of .60, and were comparable with, or slightly lower than, those from the October 2009 tests. In October 2011, runway-friction testing was carried out and the average runway friction coefficient numbers for runway 11/29 ranged from just above to well above TC's maintenance-planning level. The overall friction levels and pattern from this current testing showed a significant decline on runway 11/29 and runway 16/34. The most notable difference was detected on Runway 16 at the 3-meter and 6-meter offset locations.
Both the macro- and microtexture characteristics of a pavement surface can significantly affect measured friction values. Macrotexture, which is the coarse texture evidenced by the aggregate or by artificially applied texture such as grooving, provides escape channels to drain bulk water. Bulk water drainage through the macrotexture delays the build-up of fluid dynamic pressure (associated with hydroplaning) to much higher speeds than the speeds found for pavements with no or poor macrotexture. Providing the pavement with a good microtexture, which is the texture of the individual stones, is the major means of combating viscous hydroplaning. Microtexture is hardly detectable to the eye, but can usually be determined from touching the surface. A good pavement microtexture has a sharp, harsh, gritty feel such as obtained when touching fine sandpaper. When TSB investigators examined the surface of Runway 11, it was found to be smooth to the touch for the majority of the width of the runway.
Runway surface-testing at 65 km/h determines the overall macrotexture condition of the pavement surface, and testing at 95 km/h provides an indication of the condition of the surface's microtexture. Federal Aviation Administration (FAA) Advisory Circular (AC) 150/5320-12C and International Civil Aviation Organization (ICAO) Airport Services Manual recommend that a complete runway survey should include tests at both 65 km/h and 95 km/h. Transport Canada does not require microtexture-testing to be carried out, and has indicated that it is not known why standards were not developed for the 95 km/h test speed.
1.11 Flight recorders
Standard 625 of the Canadian Aviation Regulations (CARs) requires a correlation check be carried out to ensure all required parameters are being recorded and are usable. Although KFL carried out correlation checks on its FDRs, it did not confirm that the FDR recorded parameters were usable i.e. a FDR download to confirm the data was correct. During TSB's examination of the occurrence aircraft's FDR data, it was noted that some of the data were not usable, even though a correlation test had previously been carried out.
Transport Canada's TP185 Aviation Safety Letter (Issue 3, 2008), Issues with FDR and CVR Data Identified as a Result of TSB Reviews, states that data available to the investigators from the FDR/CVR at the time of an accident or incident may not be as readable or ultimately useful as it could be and that annual requirements to maintain CVR and FDR systems are not being consistently and effectively applied. The safety letter provides a brief overview of the purpose and means of conducting a correlation check including the following:
The purpose of the FDR correlation check is to ensure all required parameters are being recorded and usable. With this in mind, it is the aircraft inputs, their interconnection and the black box itself that affect the usability of the data. Additionally, continued correlated positions and data readout for known flight control position or other input position must be ensured on FDR readings. The purpose of this correlation is to determine the observed relationship between the annual readings and those taken at the time of installation of the devices.
The safety letter also suggests that the operator or maintainer revisit their last CVR/FDR results. If these results are not available or contain discrepancies, such as unclear CVR channels or nonfunctioning FDR parameters, then the test results are to be located or the tests are to be redone to ensure that the CVR and FDR meet the requirements of the CARs.
The TSB has previously identified concerns with the quality of FDR data in other occurrences such as report number A04A0110. In that occurrence the TSB identified the following finding as to risk:
The flight data recorder (FDR) portion of the cockpit voice and flight data recorder (CVFDR) had not been checked in accordance with regulations and therefore poor data quality with some of the parameters on the recorder had not been identified.
1.12 Wreckage and impact information
Refer to sections 1.3 Damage to Aircraft and 1.4 Other Damage.
1.13 Medical and pathological information
N/A
1.14 Fire
N/A
1.15 Survival aspects
N/A
1.16 Test and research
N/A
1.17 Organizational and management information
1.17.1 Company operations
The Kelowna Flightcraft Group of Companies was founded in 1970 and currently consists of KFACL, KFL and the subsidiary Allied Wings. The company's head office is in Kelowna, British Columbia. KFACL is the exclusive air cargo carrier for Purolator Courier Ltd. The fleet includes Convair CV580s, Boeing B727-200s, McDonnell Douglas DC10-30Fs and Israel Aircraft Industries Astra 1125s. KFACL is a CAR 705 air carrier and has over 135 staff dedicated to flight operations. KFL is an approved aviation maintenance organization and operates 2 maintenance, repair and overhaul facilities in Kelowna and Hamilton, Ontario. There is about 750 staff at these facilities that maintain, modify and engineer aircraft and components. Allied Wings, operates the Canadian Forces Contracted Flying Training and Support program, under contract with the Government of Canada. The facility, Canada Wings Aviation Training Centre, is located near Winnipeg, Manitoba.
1.17.2 Aircraft performance data
KFACL provides the Aircraft Performance Group Inc. with aircraft performance data for its specific aircraft. It produces and supplies KFACL with an aircraft specific landing performance table that shows the maximum landing weight permitted for a specific runway (Appendix B – Landing Performance). The landing performance tables take into consideration winds, anti-skid operational or not, auto or manual spoiler operation, engine and wing anti-ice selection. No landing distance can be determined utilizing this table. The landing performance tables for all company destinations are retained onboard each of KFACL's aircraft.
Landing distance can be determined using a quick reference chart or the B727 Performance Manual available to the pilots in the cockpit.
1.17.3 KFACL Boeing normal procedures
The Boeing 727-200 Performance-JT8DT-17 pageFootnote 16 (Appendix D - Performance) identifies a reference speed for approach and landing (Vref) based on the landing weight and the flaps set at 40°. If the flaps are set at 30° then 4 knots must be added to the value shown. KFACL refers to Vref as the bug speed.
The Boeing recommended approach speed is Vref plus the wind correction: ½ the steady headwind plus the entire gust value up to a maximum of 20 knots. KFACL's policy for determining the aircraft's approach-and-landing speed is to use whichever speed is greater: Bug plus 10 knots or Bug plus the wind correction. KFACL refers to this final speed as the target. In all cases, the gust correction should be maintained to touchdown while the steady wind corrections may be bled off as the aircraft approaches touchdown.
The crew calculated the target speed for the occurrence aircraft at 154 knots: 136 knots (Vref at flaps 40°) plus 4 knots (for flaps set at 30°) plus 7 knots (½ wind) plus 7 knots (entire gust).
1.17.4 Landing on wet or slippery runways
The Boeing 727 Operations Manual provides pilots with guidance to minimize stopping requirements after touchdown:
- Plan to touchdown 1000 feet from the approach end of the useable runway.
- Maintain close control over the approach speeds and maintain speed recommended for the existing conditions.
- The aircraft should be flown firmly on to the runway at the aiming point (1000 feet) even if speed is excessive.
- If an unsatisfactory approach is likely to cause touchdown far down the runway, go-around and make a second approach.
According to the Boeing 727 Maneuvers Manual, a normal landing has a touchdown target of 1000 feet with a touchdown area of 500 to 1500 feet from the threshold.Footnote 17
In addition, the manual includes a section which discusses crosswinds and the use of reverse thrust:
The reverse thrust side force and a crosswind can cause the airplane to drift to the downwind side of the runway if the airplane is allowed to weathervane into the wind. As the airplane starts to weathervane into the wind, the reverse thrust side force component adds to the crosswind component and drifts the airplane to the downwind side of the runway. Main gear tire cornering forces available to counteract this drift will be reduced when the anti-skid system is operating at maximum braking effectiveness for existing conditions. To correct back to the centerline, reduce reverse thrust to reverse idle and release the brakes.
The above information is also included in the KFACL's Boeing 727 Operations Manual.
1.18 Additional information
1.18.1 Hydroplaning
Neither the KFACL's Boeing 727 Operations Manual Vol. 1 or the Boeing 727 Airplane Flight Manual (AFM) make any mention of hydroplaning. KFACL relies on the TC Aeronautical Information Manual (AIM) for hydroplaning guidance as they do not provide any specific training or instructions.
Transport Canada's AIM discusses wet runways to assist pilots in developing handling procedures when these conditions are encountered, including the susceptibility of aircraft tires to hydroplane on wet runways and the effects of braking coefficients on wet surfaces. In summary, it states that pilots should therefore be aware of this since it will result in a substantial difference between the takeoff and landing roll aircraft performance under the same runway conditions.
According to the Boeing 727 Operations Manual, when a skid or loss of directional control is experienced, then the brakes are to be immediately released.
Hydroplaning occurs when a layer of water builds up between the aircraft tires and the runway surface, leading to the loss of traction and thus preventing the aircraft from responding to control inputs such as steering or braking. The AIM notes that, although the resultant increase in stopping distance is impossible to predict accurately, it has been estimated to increase as much as 700%. Once hydroplaning starts, it can continue well below the minimum, initial hydroplaning speed. Should hydroplaning occur, a crosswind will cause the aircraft to simultaneously weathervane into the wind as well as slide downwind.Footnote 18 Both smooth runway surfaces and smooth tread tires will induce hydroplaning with lower water depths.
Dynamic hydroplaning, which can occur during the higher speeds of landing and take-off ground roll, is the result of the hydrodynamic forces developed when a tire rolls on a water covered surface.Footnote 19 Dynamic hydroplaning is influenced by tire tread, water layer thickness and runway macrotexture. When there is sufficient macrotexture on the surface and/or the tire has proper tread, total dynamic hydroplaning will usually not occur. Dynamic hydroplaning can occur when the water depth is high enough that both tire tread and runway macrotexture cannot drain the water quickly enough. As little as 0.5 mm of water has been found to be sufficient to support dynamic hydroplaning.Footnote 20
Viscous hydroplaning occurs when a tire is unable to puncture the thin water film (no more than 1/1000 of an inch in depth is all that is needed) on the pavement and rolls on top of the water. This can occur at a much lower speed than dynamic hydroplaning, but requires a very smooth runway surface, such as an area that has been subjected to polishing by traffic or other means. Viscous hydroplaning is associated with damp/wet runways and once begun can persist down to very low speeds.
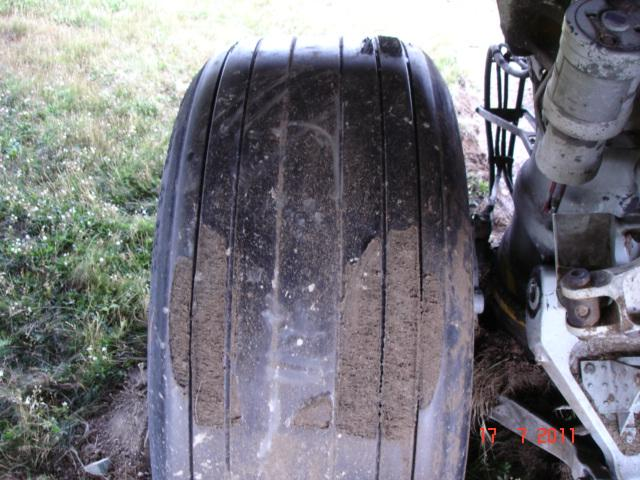
If braking demand exceeds the tire/pavement friction capability, the tire loses its grip with the pavement and rapidly spins down to a locked wheel condition. Locked wheel sliding or non-rotating tires have a lower hydroplaning speed than rolling tires. Prolonged wheel lockup can result in reverted rubber hydroplaning. Reverted rubber skid mode is the most catastrophic for aircraft operational safety because of the low braking friction and that tire cornering capability drops to zero when wheels are locked. Reverted rubber hydroplaning generates enough heat to change water into steam and to melt the tire rubber to its original uncured state (revert). Only this type of hydroplaning produces a clear mark on the tire tread in the form of a burn, i.e. a patch of reverted rubber (Photo 3).
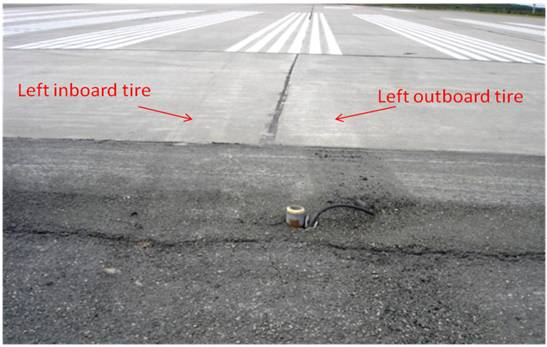
Signs of reverted rubber hydroplaning were observed on all 4 main tires. Numerous steam-cleaned marks from all 4 main wheel tires were observed on the runway (Photo 4) including about 2000 feet of marks made by the 2 left main landing gear tires when the aircraft was left of the runway centerline.
Once started, reverted rubber skidding will persist down to very low speeds, virtually until the aircraft comes to rest.
A Boeing 737 which landed on runway 29 about 15 minutes before the occurrence aircraft also experienced reverted rubber hydroplaning to the extent that a main wheel/tire assembly had to be replaced due to damage done to the tire. In addition to this occurrence, over the past 4 years the St. John's Airport has recorded 8 occurrences of hydroplaning which resulted in rubber deposits being found on the runway; 3 of these were with KFACL aircraft. In the last 10 years, there had been 1 other runway overrun at St John's Airport involving a Boeing 727 cargo aircraft. The St John's Airport Authority did not perform a formal risk assessment of the 8 hydroplaning occurrences or this previous runway excursion because they did not consider the number of events to be abnormal. They did an internal risk assessment (not formal) and concluded that, at the time, no further action was required.
Following the overrun, the St, John's Airport Authority carried out a review, utilizing the SMS tools it had in place, and determined that it would implement an expanded runway-friction testing program. The first expanded program was carried out in May 2012. In addition to TC requirements, the 2012 annual runway-friction testing program included more extensive friction-testing, utilizing the standard ICAO/FAA test conditions and increasing the number of longitudinal test runs at various offset distances from runway centerline. The Airport Authority also conducted runway macrotexture measurementsFootnote 21 on runways 11-29 and 16-34.
1.18.2 Tire tread depth and aircraft braking
When grooves are cut or molded into a tire tread to form a tread pattern, the area of actual rubber contact with the pavement in the tire footprint is reduced which increases the rate of flow of water draining out of the footprint.Footnote 22 This delays the hydroplaning effects on wet or flooded pavements to higher speeds. Excessive tire-tread wear can greatly increase the time required for the wheel to spin up following brake release.
The Goodyear Tire & Rubber Company states that when an aircraft tire has worn to the base of any groove at any spot, or to a minimum depth as specified by the aircraft manufacturer, the tire should be removed.Footnote 23 Michelin recommends that in the absence of specific instructions from the aircraft manufacturer, a tire should be removed from service for wear, based on the fastest wearing location, when the wear level reaches the bottom of any groove along more than ⅛ of the circumference on any part of the tread, or if either the protector ply (radial) or the reinforcing ply (bias) is exposed for more than ⅛ of the circumference at a given location.Footnote 24
The National Aeronautics and Space Administration (NASA) conducted wet-runway braking tests.Footnote 25 On the wet runway, a gradual degradation in braking effectiveness was experienced up to about the 80% worn tire-tread condition, thereafter the wet-runway friction coefficients decreased markedly. The completely worn tire was observed to develop, at the higher speeds, only about one-half the braking effectiveness of a new tire. The Boeing 727 Maneuvers Manual states the coefficient of friction depends on the tire condition and runway surface (concrete, asphalt, dry, wet or icy).
A tire's footprint taken at the 95% worn condition resembled that of a completely worn tire, indicating that tire deformation had in effect eliminated the grooves at this wear condition.Footnote 26 Therefore, the effects on braking performance of the degree of tread wear of a tire cannot accurately be gauged by eye, since at 95% worn there is a continuous tread pattern although the tire behaves very much like a smooth tire during braking.
The TSB calculated the wear, based on initial retread depth of 0.43 inches and the average tread depth remaining, on the occurrence aircraft's No. 1 tire to be about 65%, No. 2 tire about 90%, and the No. 3 and No. 4 tires were in excess of 95% worn (Photo 5).
1.18.3 Runway safety
In March 2010 and again in June 2012, the TSB issued its Watchlist which identifies the safety issues investigated by the TSB that pose the greatest risk to Canadians. Landing accidents and runway overruns was one of the safety issues identified. To combat the risk of runway overruns, the TSB Watchlist highlighted the importance of the provision of timely information about runway surface conditions and having an adequate safety area beyond the runway's end.
Transport Canada's TP 312E - Technical Publication Aerodromes Standards and Recommended Practices defines a runway end surface area (RESA) as an area symmetrical about the extended runway center line and adjacent to the end of the strip intended to reduce the risk of damage to an aeroplane undershooting or overrunning the runway and facilitate the movement of rescue and fire fighting vehicles. Current Transport Canada requirements for a RESA do not meet the ICAO standard nor the recommended practice.
As a result of the Air France investigation (A05H0002), the TSB recommended that:Footnote 27
The Department of Transport require all Code 4 runways to have a 300 m runway end safety area (RESA) or a means of stopping aircraft that provides an equivalent level of safety.
A07-06
In its response to this recommendation, TC indicated its intention to harmonize with the current ICAO 90 meter standard for RESA requirement. At the time this report was written, TC has proposed regulatory change; however, the safety deficiency remains at many Canadian airports.
A 90-metre RESA for Runway 11/29 is planned for 2013. The RESA construction work for Runway 11, which is located off the threshold of Runway 29 where the occurrence aircraft overran, will require only minimal site grading as the ground conditions in that location are already conducive to RESA requirements in terms of slopes and suitability of existing soil conditions.
1.18.4 Grooved runways
According to a report prepared for TC, the risks associated with landings during heavy rainfall on un-grooved runways are currently much higher than acceptable levels in commercial aviation.Footnote 28 The high number of overruns is due to hydroplaning, which causes a loss of directional control and can reduce braking to nil.
Cutting or forming grooves in existing or new runways is a proven and effective technique for improving drainage, minimizing skids and drift, improving braking, and reducing the risk of hydroplaning.Footnote 29
There is currently no regulation requiring grooved runways at Canadian airports. In Canada, runway grooving has been used to address site specific issues, such as to promote drainage on runways with low or problematic transverse slopes, which could not be corrected cost-effectively by other means.
On 11 November 2012, TC Advisory Circular (AC) 300-008 became effective. This AC provides information and guidance regarding the grooving of runway pavements. In particular, the document outlines factors determining the need for grooving, as well as grooving technique, specifications, maintenance, and winter operations. It provides an example of an acceptable means, among others, of demonstrating compliance with regulations and standards.
The AC identifies the following factors that should be considered in determining the need for runway grooving:
- Historical review of aircraft accidents/incidents related to hydroplaning at the airport;
- Wetness frequency (review of annual rainfall rates and intensity);
- Transverse and longitudinal slopes, flat areas, depressions, mounds, or any other surface abnormalities that may impede water runoff;
- Surface texture quality, which if not sufficient, may contribute to slipperiness under dry or wet conditions. Examples of conditions which may lead to a loss of available surface friction are polishing of aggregate, improper seal coating, inadequate micro-texture or macro-texture, and contaminant build-up that reduces surface texture; and
- Crosswind effects, particularly when low friction factors prevail at the airport.
In 2008, St. John's Airport carried out a major runway rehabilitation project on runway 16/34. Results from the annual friction-testing had consistently reported that the runway's friction values were above TC's maintenance-planning level.
1.18.5 Runway surface condition reporting
Outside the winter Aircraft Movement Surface Condition Report (AMSCR) reporting period, St. John's Airport personnel carries out a daily airfield inspection to address issues such as standing water. Personnel does not carry out an inspection of the runway surface when rain starts or periodically while rain is falling, nor is there any requirement to do so.
Section 2.5.1.1.of TP312E states:
Standard — Information on the condition of the movement area and the operational status of related facilities shall be provided to the appropriate aeronautical information service units, and similar information of operational significance to the air traffic services units, to enable those units to provide the necessary information to arriving and departing aircraft. The information shall be kept up to date and changes in conditions reported without delay.
TP312E does not contain specific direction on how to assess the runway surface condition for the amount of water on the runway. An AMSCR was carried out about 30 minutes after the occurrence flight landed and all runways were reported to be 100% bare and wet.Footnote 30 No standing waterFootnote 31 was noted.
The latest daily inspection had been carried out the day before at 09:30.
1.18.6 Canadian runway friction index
According to the AIM, runway friction readings will not be taken and a Canadian Runway Friction Index (CRFI) will not be provided to air traffic services or pilots when the runway surface is simply wet with no other type of contamination present, as runway-friction readings produced by decelerometer devices may result in inaccurate readings under this condition. Runway-friction values during the summer period and when it is raining are not reported.Footnote 32
1.18.7 Safety management system
In 2005, the Canadian Aviation Regulations (CARs) were amended to require the holders of certain Canadian aviation documents, including an air operator certificate issued under section 705.07 of the CARs, to establish, maintain, and adhere to a safety management system (SMS). SMS has been adopted internationally by the International Civil Aviation Organization (ICAO), to which Canada is a signatory.
A SMS is designed to integrate hazard identification and risk management systematically into every aspect of a company's business, throughout the organization, rather than having safety management as a separate activity within the company structure. Companies operating under Part 705 of the CARs are required to have in place a documented SMS which includes:Footnote 33
- a safety policy on which the system is based;
- a process for setting goals for the improvement of aviation safety and for measuring the attainment of those goals;
- a process for identifying hazards to aviation safety and for evaluating and managing the associated risks;
- a process for ensuring that personnel are trained and competent to perform their duties;
- a process for the internal reporting and analyzing of hazards, incidents and accidents and for taking corrective actions to prevent their recurrence;
- a document containing all safety management system processes and a process for making personnel aware of their responsibilities with respect to them;
- a quality assurance program;
- a process for conducting periodic reviews or audits of the safety management system and reviews or audits, for cause, of the safety management system; and
- any additional requirements for the safety management system that are prescribed under the Regulations.
Notably, SMS includes:
- a reactive process that reports, investigates, analyzes and corrects reported hazards, events, and safety concerns; and
- a proactive process that seeks to identify potential hazards and evaluate the associated risks before adverse events occur.
The operator is also expected to conduct a self-evaluation of its SMS through periodic reviews and audits and through its quality assurance (QA) program.
Transport Canada carries out assessments of operators' SMS to determine their effectiveness. These consist of a documentation review and on-site review of the entire organization to determine if the SMS is documented, in place and effective. In addition, Transport Canada conducts program validation inspections (PVI) comprised of a focused review of one or more components of an organization or its SMS.
Transport Canada conducts surveillance of an operator's overall SMS processes rather than detailed prescriptive oversight over individual activities and actions as was previously practiced. Transport Canada's guidance to inspectors conducting SMS assessments and PVIsFootnote 34 at the time of the occurrence stated:
The introduction of Safety Management Systems (SMS) for the aviation industry will fundamentally change the way Transport Canada (TC) approaches its oversight responsibilities… Traditional oversight methods focused solely on determining regulatory compliance using a system of direct inspection of an organization's aircraft, personnel, records and other systems. The new approach employing Assessments and PVIs will allow TC's oversight to evolve beyond compliance auditing to a system that examines the effectiveness of an organization's management system. These changes are consistent with the principles of safety management systems where the organization is expected to take an ownership role in proactively managing risks and have programs in place to ensure they comply with regulatory requirements. TC's role is to ensure that organizations have effective policies, processes and procedures in place to accomplish this.
As an operator's SMS matures, TC oversight would shift from traditional audit and inspection to process auditing. The monitoring of SMS outputs would increasingly focus on the results of the operator's QA program.
1.18.8 System management systems at KFACL and KFL
The operator's RMS Policy and Procedure Manual sets out how it will comply with TC's requirement for a safety management system. The manual was created to describe policies and procedures for the RMS and is to be used jointly by KFACL and KFL. Transport Canada approved this manual on 13 December 2006.
The RMS Policy and Procedure Manual is the over-riding document setting out the company's standards for managing risk assessments of all operations and functions. Decisions affecting aviation safety are to be handled using a risk-management framework.
The operator's RMS is based on identifying hazards through reactive and proactive reporting. All employees are required to participate in the RMS and report safety hazards. Reactive reporting is based on an event which has already taken place and is described as an irregularity, occurrence or accident. Proactive reporting would identify a potential type of hazard before an event occurs. The RMS manual does not provide any examples or explanation of what type of hazard would be proactively reported, nor does it define what types of events or hazards are reportable. However, the manual does state:
Risk evaluation will be performed prior to the introduction of new special projects or processes to identify and mitigate potential hazards and risks.
Employees were aware that the company had a RMS and had received RMS training. They were also aware that there was a requirement to report potential safety hazards and they knew where to locate the proper reporting form. Some maintenance and flight crew employees indicated that it was not typical to report issues such as fuse-plug releases, local practices like misting aircraft brakes or worn tires to the company's RMS.
As the tires were deemed serviceable, KFL indicated that even though the flight crew expressed concerns twice concerning the condition of the tires, it would not expect the crew to report the tire condition through the RMS as a potential safety hazard.
1.18.9 Transport Canada's assessment of KFL group's risk management system
Transport Canada carried out a PVI of KFL Group's RMS in June 2011 for the purpose of determining its effectiveness and ensuring its compliance with the CARs. Transport Canada's expectation of an effective SMS is that the organization's risk management process assesses risks associated with identified hazards. Transport Canada determined that the company's risk management process did not consistently and effectively:
- Identify source hazards from reported events and
- Define and document risk scenarios associated with all hazards before assessing probability & severity of the worst credible outcome(s)
Transport Canada was provided with a corrective action plan (CAP) to address the findings of the 02 September 2011 inspection. It accepted the CAP in April 2012.
2.0 Analysis
The investigation determined that the aircraft was serviceable for the flight and that pilot incapacitation, physiological factors or fatigue did not contribute to this occurrence. The investigation focused on the factors associated with landing on a wet runway, maintenance procedures relative to worn tires and hot brakes, and the operators' SMS (KFACL, KCL and Airport Authority).
2.1 Hydroplaning
The aircraft touched down about 1850 feet from the threshold, and at a higher than required airspeed, which reduced the available runway length to stop the aircraft.
About 8 seconds after touchdown, the crew applied the wheel brakes and almost immediately noted that the aircraft was skidding. Braking was maintained throughout the landing roll and up until the aircraft stopped. Pieces of reverted rubber were found on the runway near the touchdown point and along the left side of the runway up to where the aircraft departed the pavement. This indicates the aircraft experienced reverted rubber hydroplaning almost immediately after the brakes were applied and periodically throughout the landing roll.
Should skidding be experienced, typical recovery method is to completely release the brakes momentarily to let the wheels spin up and establish an adequate speed reference.
When hydroplaning occurs, which reduces wheel contact and friction, a crosswind will exacerbate the aircraft's natural tendency to weathervane into the wind. Both smooth runway surfaces and smooth tread tires will induce hydroplaning with lower water depths.
Although the exact depth of water could not be determined, the presence of water on the runway caused the aircraft to hydroplane, which led to a loss of directional control and braking ability, increasing the required stopping distance. This condition was exacerbated because the brakes were held on throughout the landing roll and the tires had excessive tread wear.
2.2 Tire wear
In this occurrence, 3 of the 4 tires were in excess of 80% worn, while the 4th tire was about 65% worn. On a wet runway, once a tire is about the 80% worn the wet-runway friction-coefficients drop markedly. Utilizing tires that are more than 80% worn reduces wet-runway traction thereby increasing the risk of hydroplaning and possible runway overruns.
2.3 Wet runways
Both the macro- and microtexture characteristics of a pavement surface can significantly affect its friction values. When TSB investigators touched the surface of runway 11/29, they found it smooth, which is inconsistent with the gritty feeling of a good microtexture. Good microtexture is the principal means of combatting viscous hydroplaning. Both the FAA and ICAO recommend that a complete runway friction survey should include tests at both 65 km/h (macrotexture condition) and 95 km/h (microtexture condition). Even though AC 300-008 states that the quality of the runway surface, including the microtexture condition, may contribute to the runway's slipperiness under wet or dry conditions, TC does not require microtexture-testing to be carried out. The practice of not testing the runway surface microtexture increases the risk of wet runway hydroplaning due to an incomplete assessment of the runway's overall friction characteristics.
2.4 Runway end safety area
Runway overruns are identified on the TSB's Watchlist as one of the top safety issues requiring further action. The Board has identified safety areas beyond the runway's end as a key measure against damage and injuries resulting from overruns. While TC has indicated its intent to meet the current ICAO standard, this has not yet occurred. The lack of adequate runway end safety areas (RESA) or other engineered systems or structures designed to stop aircraft that overrun increases the risk of aircraft damage and passenger injuries.
2.5 Runway grooving
Aircraft landing performance on wet runways is a widely recognized safety concern. Grooved runways improve drainage thereby minimizing skids and drift, improve braking, and reduce the risk of hydroplaning. Studies have shown that wet, grooved runways often provide almost the same level of braking as on dry runways. The use of non-grooved runways increases the risk of wet runway overrun due to a reduction in braking characteristics.
2.6 Anti-skid system
When the firefighters arrived at the aircraft, they confirmed that all 4 brakes were hot. For all 4 brakes to be hot, brake pressure must have been applied to all 4 brakes. The anti-skid control unit had to be serviceable at the time of the overrun for this to happen.
2.7 Runway surface condition reporting
Rain, snow, ice, or slush contaminates runways and affects landing distance. To accurately assess the suitability of a runway for landing, crews must have a clear understanding of the current condition of the runway, particularly when contamination is a possibility. The current runway surface condition (RSC) reporting standards and recommended practices are focused on winter conditions. These standards and recommended practices are ambiguous and lack clear direction regarding runway inspections during periods of heavy rain or in the presence of standing water on the runway. While it is understood that measuring the effects of water on runways presents certain challenges, the lack of clearly defined RSC reporting standards related to water on runways increases the risk of hydroplaning.
2.8 Safety management system
Comprehensive reporting of safety hazards is essential to an effective safety management system (SMS). This would include reporting of non-routine situations that could represent hazards such as local practices or adaptations from documented procedures (e.g. misting of wheels) and occurrences where issues could have been reported through the company's RMS (e.g. fuse-plug releases) but were not.
Even though the company's RMS was in place and training had been provided, some maintenance and flight crew employees were still not clear on their obligations to report issues. KFL has indicated that even if a potential safety concern is noted, such as the crew's concern about the condition of the tires, unless the concern falls outside published requirements (such as the airplane maintenance manual) or guidance, then the safety concern is not to be reported and addressed through the RMS. The RMS policy and procedure manual did not provide explicit guidance on what may be considered a hazardous situation or condition, nor was any specific training provided. Employees will submit more incident reports if they are trained to recognize specific hazardous situations or conditions and areas they think the SMS should review. If all employees do not fully understand their reporting obligations and have not adopted a safety reporting culture as part of everyday operations, SMS will be less effective in managing risks.
Although KFL implemented a number of practices/procedures to address the frequent brake heating/fuse-plug release condition, it did not address these issues through the framework provided by its RMS. This resulted in a missed opportunity to identify potential safety risks (loss of directional control, hydroplaning, runway overruns) and take appropriate mitigating actions. Furthermore, the company RMS did not specifically review the earlier occurrences of hydroplaning at St. John's Airport to identify the underlying factors and take follow-up corrective action.
The misting on the brakes was introduced at some locations without being reviewed under the company's RMS as required by its policy and procedure manual. This practice became standard and was considered normal, even though the aircraft manufacturer did not recommend use of water on the brakes except in specific circumstances. This unapproved adaptation and associated risks could have been identified had it been reviewed by the company's RMS.
Transport Canada conducted a program validation inspection in June 2011. Transport Canada determined that the company's risk management process did not consistently and effectively:
- identify source hazards from reported events; and
- define and document risk scenarios associated with all hazards before assessing probability & severity of the worst credible outcome(s)
When an operator's SMS is not fully effective, there is an increased risk that hazards will not be identified and mitigated.
Although there had been a number of runway overruns at St. John's Airport, the Airport Authority only did an internal, informal risk assessment and concluded there was no need to proceed any further. When organizations do not conduct formal risk assessments in accordance with their SMS, there is a risk that hazards will not be identified and mitigated.
3.0 Findings
3.1 Findings as to causes and contributing factors
- The aircraft touched down about 1850 feet from the threshold, and at a higher than required airspeed, which reduced the available runway length to stop the aircraft.
- Excessive tread wear and the wet runway caused the aircraft to hydroplane, which led to a loss of directional control and braking ability, resulting in the aircraft overrunning the runway.
- The brakes were not released when the skid occurred, which reduced the effectiveness of the anti-skid system.
3.2 Findings as to risk
- Utilizing tires that are more than 80% worn reduces the wet runway traction thereby increasing the risk of hydroplaning and possible runway overruns.
- The practice of not testing the runway surface microtexture increases the risk of wet runway hydroplaning due to an incomplete assessment of the runway's overall friction characteristics
- The lack of adequate runway end safety areas (RESA) or other engineered systems or structures designed to stop aircraft that overrun increases the risk of aircraft damage and passenger injuries.
- The use of non-grooved runways increases the risk of wet runway overrun due to a reduction in braking characteristics.
- If all employees do not fully understand their reporting obligations and have not adopted a safety reporting culture as part of everyday operations, SMS will be less effective in managing risks.
- When an operator's SMS is not fully effective, there is an increased risk that hazards will not be identified and mitigated.
- The lack of clearly defined runway surface condition (RSC) reporting standards related to water on runways increases the risk of hydroplaning.
- If cockpit voice recorders (CVR) and flight data recorders (FDR) are not checked in accordance with regulations, there is risk that the recorded data will not be useable and potentially valuable information may not be recorded.
3.3 Other finding
- Main wheel assembly part number 10-61287-14 is not identified on the list of approved-main landing gear wheel assemblies for aircraft operating up to 195 500 pounds maximum taxi weight.
4.0 Safety action
4.1 Safety action taken by Kelowna Flightcraft Air Charters
Following the occurrence, Kelowna Flightcraft Air Charters updated its crew resource management training to include landing distances, braking, wet and contaminated runways, and crosswind landings.
Following the occurrence, Kelowna Flightcraft enhanced the test procedures for FDR recordings.
4.2 Safety action taken by St. John's International Airport Authority
Following the occurrence the St. John's International Airport Authority implemented an expanded runway friction-testing program. This program includes more extensive friction-testing, increasing the number of longitudinal test runs at various offset distances from runway centerline, and conducting runway macrotexture measurements.
This report concludes the Transportation Safety Board's investigation into this occurrence. Consequently, the Board authorized the release of this report on . It was officially released on .
Appendices
Appendix A - List of TSB laboratory reports
The following TSB Laboratory reports were completed:
- LP078/2011– FDR/CVR Analysis
- LP079/2011– CVR Download/ Transcription
- LP081/2011– Examination of Tires and Brakes
These reports are available from the Transportation Safety Board of Canada upon request.
Appendix B – Landing performance

(Source: Aircraft Performance Group, Inc.)
Appendix C – Aerodrome chart
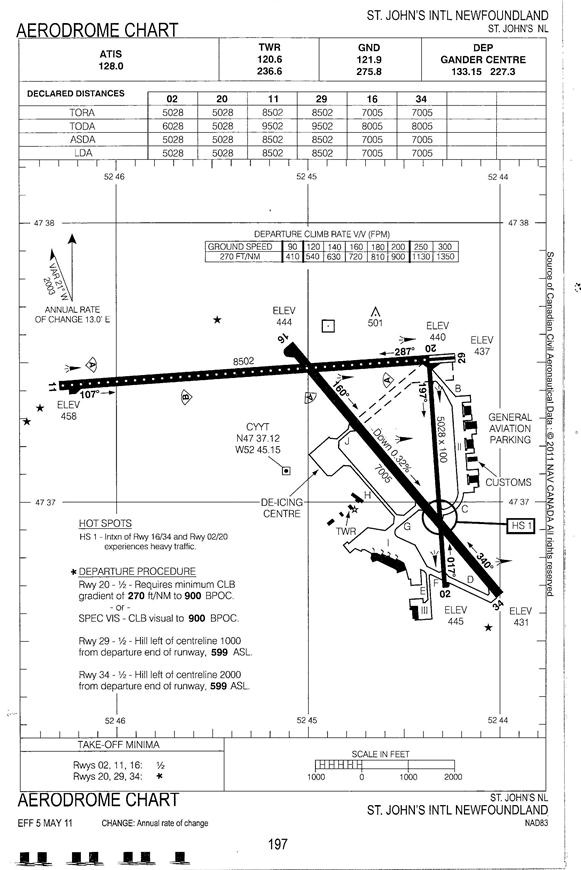
NOT FOR NAVIGATION PURPOSES
(Source: Nav Canada Air Pilot – Instrument procedures)
Appendix D - Performance

(Source: Kelowna Flightcraft - Aircraft Performance Manual)